With ten-year US and Australian bonds marching towards 5% yields, I will explain the effects of higher bond yields - that normally create headwinds for equity markets.
In this post-Covid cycle, with interest rates lifting from extraordinary lows, the headwinds are now obvious, but I suggest that they will have a milder effect on equity prices than historic precedents. Whilst history gives investors an insight for how equity prices perform when bond yields rise, we must acknowledge how this time is different given that cash interest rates remain below inflation.
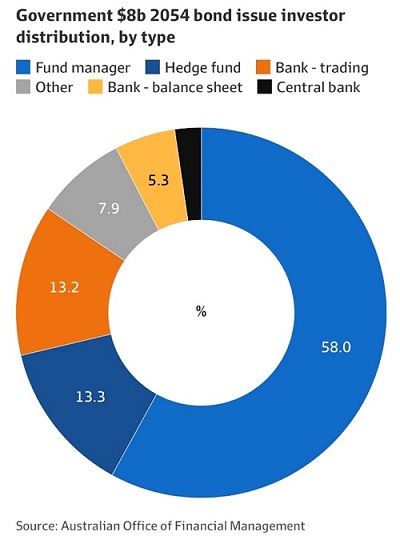
With rates lifting from ridiculously low levels, there can be little doubt that the interplay between rising bond yields and equity markets has been muted up until recently. However, it is likely that if long dated bond yields leap through 5%, equity markets will begin to feel pain. But then again, so will last week's $8 billion of buyers in the 31-year Australian Government bond tender. Those bonds cleared at a yield of just under 5% p.a.
What impact of higher bond yields on stocks
The effect of higher bond yields on equity prices is fairly simple. If risk free returns measured by interest cash flows (receipts) rise, then the required cash flows from higher risk assets (such as equities) will be required to rise as well. If earnings growth is not pushing against the PER decline, then share prices must decline to create the appropriate return for the investor.
Whilst the actual cash flows for individual companies can be calculated by deep financial analysis, they can also be quickly estimated by calculating the “earnings yield” of a company from market forecasts. The earnings yield (the inverse of the PE ratio) is the percentage of the company’s earnings per share.
For instance, a company that is forecast to be trading on a PER of 15x has an earnings yield of 6.66%. The earnings yield allows for a comparison of the company’s propensity to pay dividends (from cash flow) with the yields in fixed interest markets or with bond yields (the “risk-free” rate of return). From the earnings yield, both the dividend payment and yield can be estimated noting that a dividend yield should not normally exceed an earnings yield. From a PER of 15x and a payout ratio of (say) 60%, a dividend yield of 4% is attained. With franking, the pre-tax yield lifts above 6%.
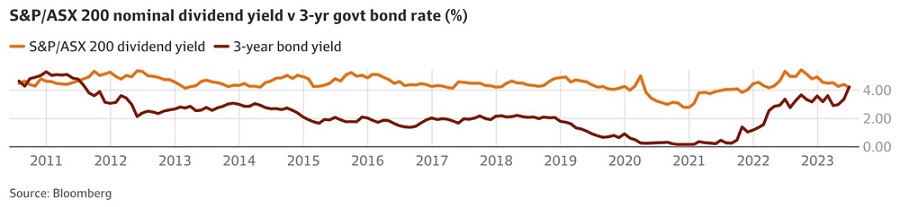
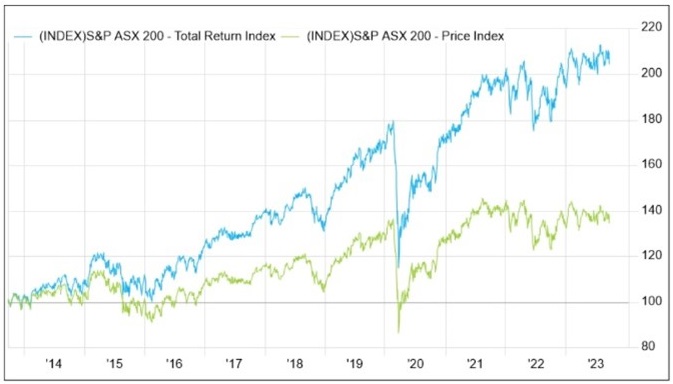
In the chart below we see the lift in Australian bond yields (3-year bonds) towards 4% as ASX dividend yields pull back to 4% (pre-franking). We have not seen ASX 200 dividend yields being matched by bond yields for over a decade.
As yields (and cash flows) from bonds increase, asset allocators and investors consider re-allocating funds from equities towards bonds or fixed income securities.
However, the allocation between equities (growth) and bonds (income) is complicated by actual or predicted inflation and the anticipated level of economic growth. This is because economic growth supports equities over bonds. Inflation devalues the cash flow or yield from fixed income bonds, particularly if those yields are below actual inflation (known as negative real yields). Indeed, that has been the feature of the last decade – a period where Central Banks utilized quantitative easing (QE) to manipulate interest rates to negligible levels.
Equity markets have been mixed
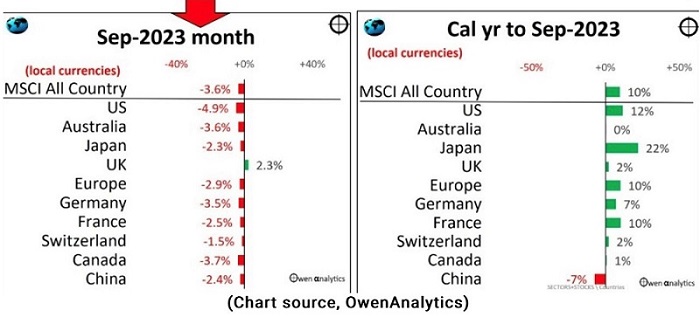
Over the last 18 months, interest rates have risen and chased inflation higher. Up until the end of September, in the face of rising interest rates, equity markets have performed reasonably well and contrary to dire predictions by some commentators. The world index had risen by about 10% in the 9 months to 30 September, driven by the heavy weighting to the US market (which has risen by about 12%). However, we should remember that over the last 2 years, the US market index is flat (including dividends) with this year's gains recovering prior year losses.
A disappointment has been the Australian market, seemingly dragged down by weakness in the Chinese economy and a devaluing AUD. In recent times, the Chinese Administration has lowered interest rates as economic growth forecasts for 2023 have been lowered from 5% to 4.5% by the OECD. While the Chinese equity market has pulled back given fears of financial issues across the property sector, the consumer has been resilient. Meanwhile European markets have produced reasonable returns, and the Japanese market has been the star performer.
Also, we must remember that the strength in the Japanese equity market follows decades of poor returns. The Japanese equity market has lifted even as its ten-year bond yields have risen from 0.5% to 0.8% over the last 9 months. This is the clearest example that rising interest rates don’t always push equities lower and particularly when those interest rates are well below inflation. The latest inflation reading in Japan is 3.5% and a full 2.5% above long dated bond yields.
Focus on the long-term
Investors should always remember that investing is a long game that requires a constant eye to asset allocation – between growth and income assets. It also requires an acknowledgement of the volatility of returns that characterise the equity market. The equity market performance in October emphasises this point with 5% corrections across the world. In effect the world equity indices have given up one PER point as long gated bond yields rose by (on average) 0.5%.
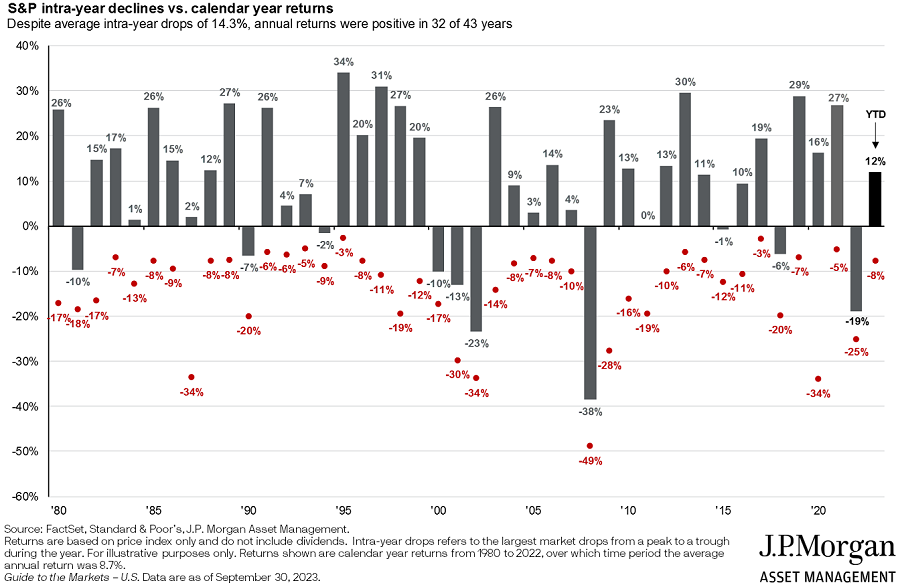
The following chart (S&P500) shows equity markets invariably suffer drawdowns during each year. However, they are more likely to rise than fall. Over the last 40 years, equity markets have often risen in the face of rising interest rates and following an initial sharp drawdown (driven by fear that Central Banks will tighten too aggressively and cause a recession).
Moving back to a long-term focus on asset returns, the next table from Vanguard is instructive. It shows (over the last 30 years) that equities have produced a compounding annual return that is at least 3% higher than Australian bonds, but remarkably similar to international bonds. Why is this so, and what does it mean for future returns from asset classes?
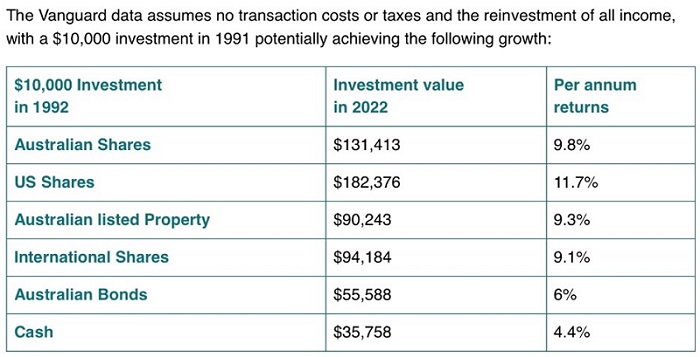
First, the international bond returns (above) were bolstered by the extraordinary utilization of QE to drive bond yields to negligible levels. Remember negative bond yields in Europe and Japan. As bond yields decline, both the value and price of bonds rise. The major period of bond price appreciation was the second decade of this century (2010 to 2020) as yields across all bond maturities moved to or below zero.
In Australia, the utilization of QE was belated and started with Covid. Therefore, our bond returns could not match those of overseas returns. Notably as bond yields everywhere have risen over the last 20 months, all bond markets have produced negative returns. Simply stated, whilst higher yields are generating higher cash flows for today's buyers of bonds, the buyers of bonds over the previous 3 years (in particular) are suffering significant capital losses.
Some predictions on future returns
As for the future, in terms of predicting asset returns, it is always easier to predict the longer term (say 5 years) than it is to predict the next 12 months. That is because history for long term asset returns is fairly stable. Equity returns will outperform bond returns over the long term because economic growth and inflation aids growth assets more than it does for income assets.
However, the next year will see the cashflow benefits of higher interest rates flowing to fixed income investors at rates that have not been seen since before the GFC (14 years ago). As fixed income returns have become attractive, the relative attractiveness of equities is contested and as explained in my opening paragraphs. Therefore, I think it is likely that fixed income returns will match and possibly exceed those of equities for the next 12 months at least. However, I do not subscribe to the belief that equities returns will be negative. Whilst I suspect that they will not be as good as those from fixed income, franking credits bolsters cash returns and dividends will grow with inflation and economic growth over time.
Based on the last 10 years it is clear that bond yields of 5% are now confronting, but they are still too low compared to inflation. Further, given the amount of government debt overhanging the markets, I do believe that Central banks will have no choice but to reintroduce QE again to hold bond yields lower for their governments.
What should self-directed investors do?
The acronym that was so popular a few years ago – TINA (There Is No Alternative – to equities), has now clearly reversed. There are plenty of alternatives to equities – at least at the moment.
Does that mean that investors need to sell out of equities? Absolutely not. But they should consider diverting any cash and cash flows from their portfolios appropriately into fixed income yield. They should mildly de-weight equities and move into fixed income – especially if high quality yields can be accessed at above 6% and thus above inflation.
My final chart re-focuses attention towards the long term returns from the Australian equity asset class. Add in franked income that greatly benefits low taxed investors, plus a disciplined strategy of reinvesting dividends, and attractive returns will accumulate over time.
John Abernethy is Founder and Chairman of Clime Investment Management Limited, a sponsor of Firstlinks. The information contained in this article is of a general nature only. The author has not taken into account the goals, objectives, or personal circumstances of any person (and is current as at the date of publishing).
For more articles and papers from Clime, click here.