Register For Our Mailing List

Register to receive our free weekly newsletter including editorials.

Home / 155

What credit spreads reveal about share markets

This article examines credit spreads, how they relate to share prices and what they can reveal about where we are in the stock market cycle.

What is a credit spread?

The ‘credit spread’ on a company bond is the extra yield demanded by investors over and above the yield on a government bond for the same term, to compensate the investor for the higher risk of loss if the borrower were to default on payment of interest or principal.

The ‘riskier’ the bond, the greater the extra yield (spread) demanded by investors. For example, a 5-year government treasury bond may trade on a yield of 2.0% per year (in early May 2016), but a 5 year ‘investment grade’ company bond might trade at 3.5%, a 1.5% credit spread above the yield on government treasuries. A sub-investment grade ‘high-yield’ (‘junk’) bond might trade at 7%, a 5% credit spread above treasury yields, because of its greater risk of default.

The extra yield return on a high-yielding bond might look attractive to investors at first sight, but if the company defaults during the term of the bond, the investor might only recover say 70% of their capital in a liquidation, creating a 30% capital loss, so the higher perceived return via higher yield may be illusory. Although bond markets are far from efficient and rationally priced, there is a good chance that the higher income yield on a risky bond will be offset by a capital loss on the principal and/or loss of interest, leaving the investor no better off than they would have been with a treasury bond.

How credit spreads change over time

Credit spreads do not remain static over time. They rise (widen) and fall (tighten) with the changing level of pessimism or optimism about the health of the corporate sector. This same pessimism or optimism is also a major driver of company share prices.

Shares tend to do well when spreads are declining (tightening), and shares tend to do poorly when spreads are increasing (widening). One does not cause the other – they are both measures of investor sentiment about the health of the corporate sector. This phenomenon has been evident over the past century of market data but here we focus on the past couple of credit cycles to highlight where we are at the moment.

The first chart shows the US S&P500 share price index from 2011 (top of chart) and three different credit spread measures (bottom section).

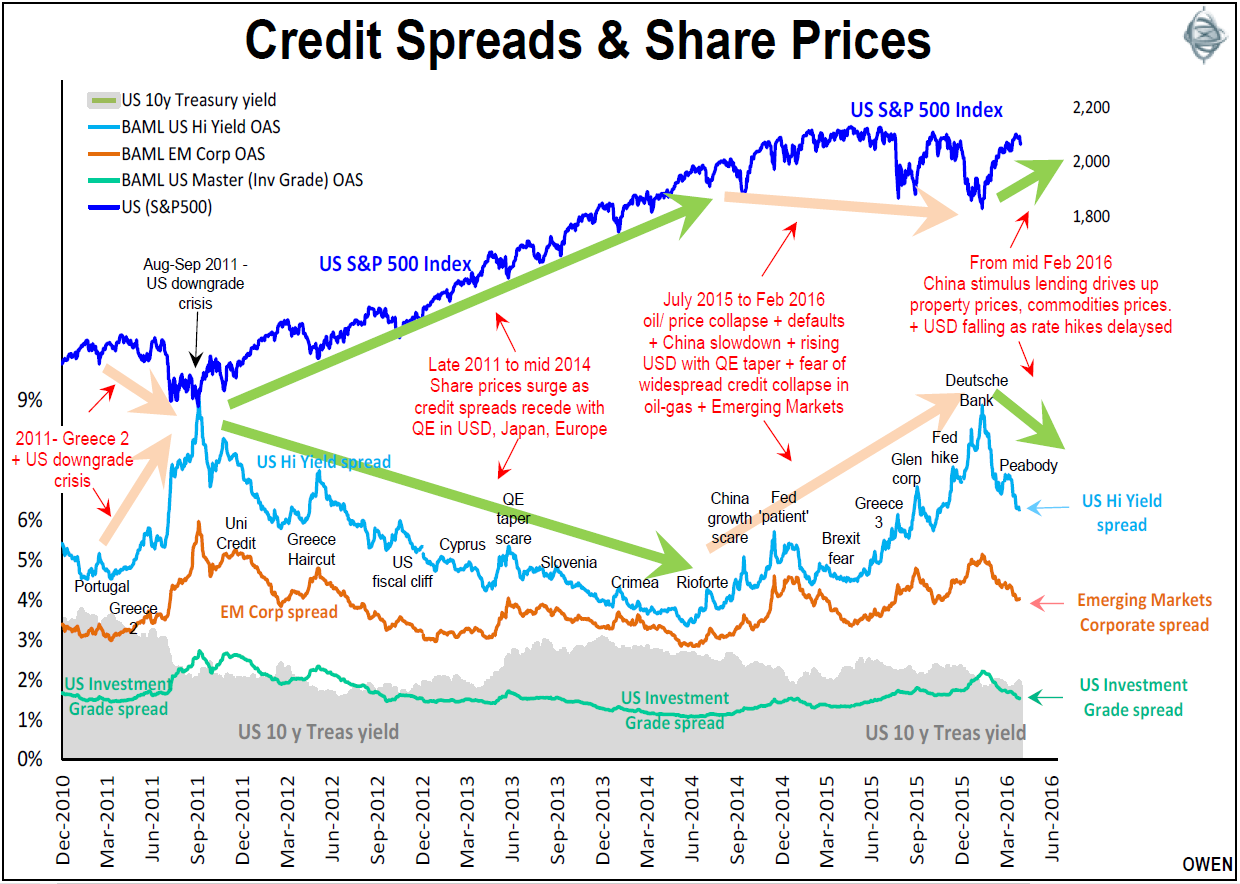
Credit spreads tend to move in parallel paths, but credit spreads and share prices have tended to move in opposite directions, as illustrated by the pairs of green and orange arrows on the chart. The chart highlights the key events that have driven market sentiment, credit spreads and share prices through the past couple of credit spread cycles.

What about Australia?

Since the Australian bond and stock markets are mostly owned and driven by foreign money, our local markets tend to follow global trends. The next chart shows average 5-year Australian corporate bond spreads (green line) following the same ups and downs as US investment grade spreads (light blue) over the same period as the first chart.

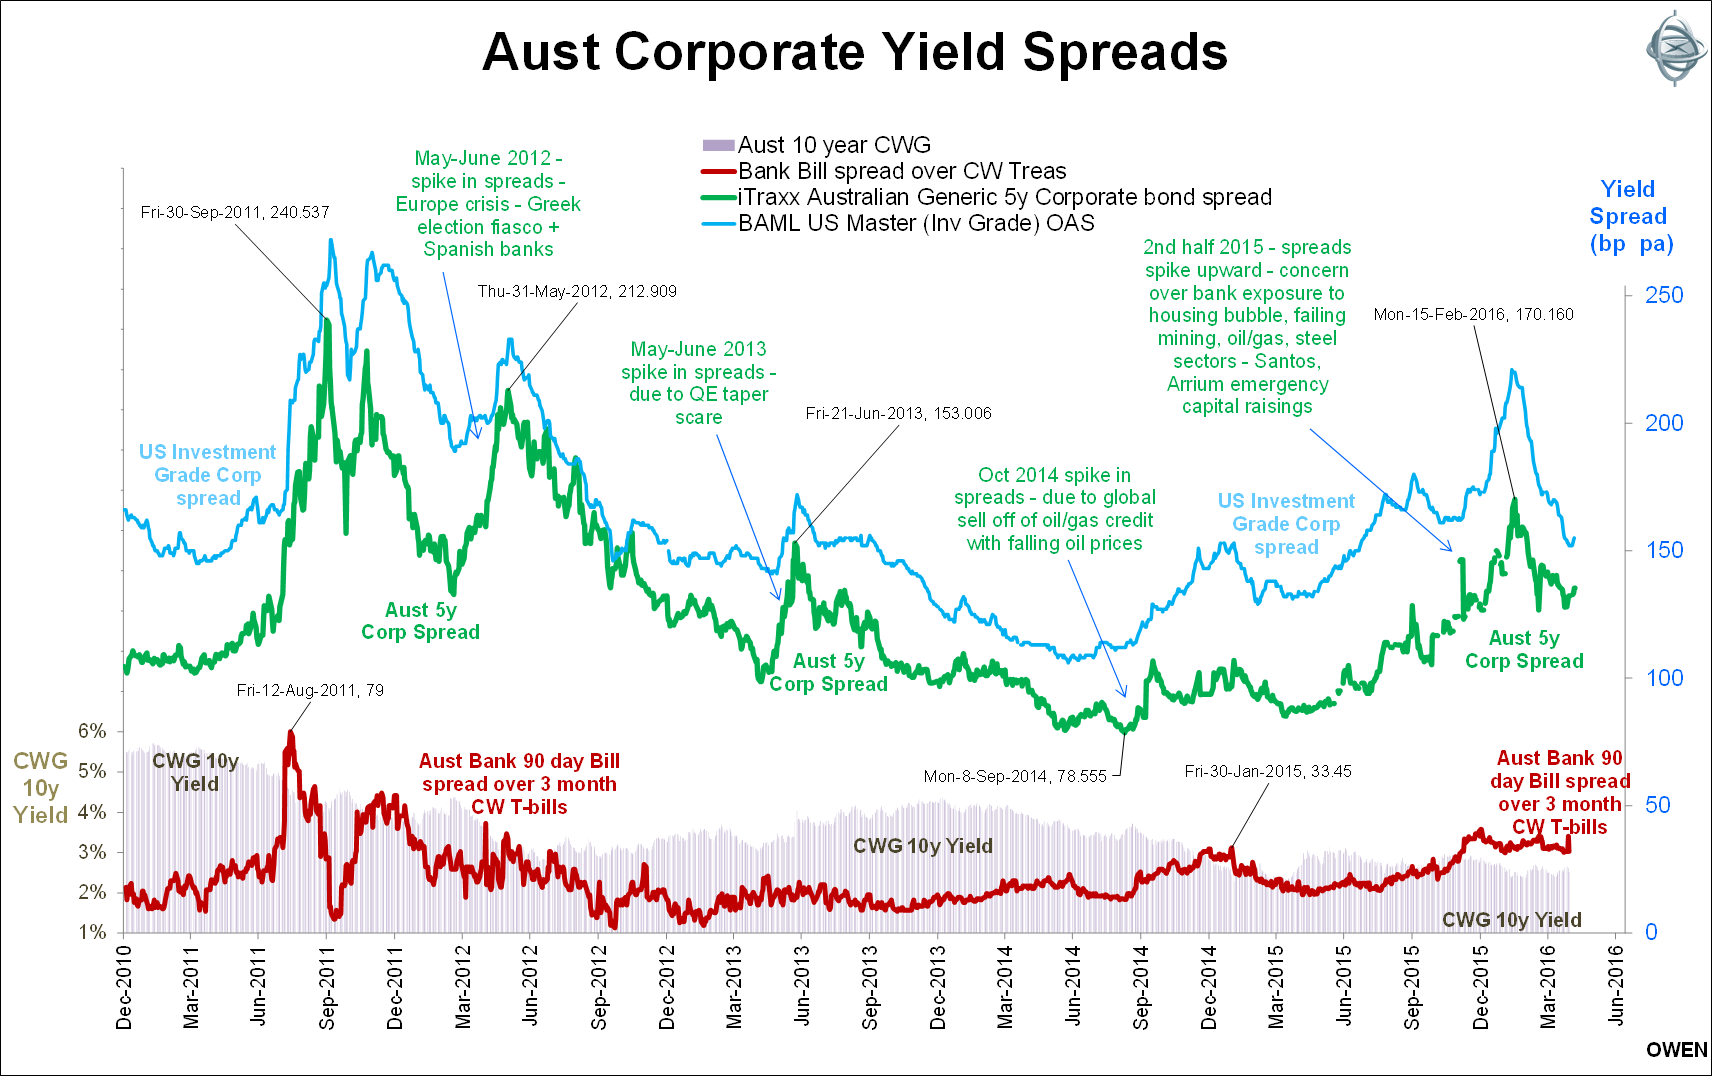
The peaks and troughs in US credit spreads are echoed consistently in Australian spreads.

The above chart also shows Australian bank spreads (maroon line), which is the spread between the 90-day Australian bank bill yield and Commonwealth 13-week Treasury bill yields. This bank spread represents the perceived degree of short term credit risk of banks. Yes, Australian banks are risky! (This bank spread pattern is also useful in helping determine when securities priced off bank bill yields – e.g. floating rate securities like bank hybrids – are expensive or cheap).

What lessons can we learn?

Both the charts show that spreads widened rapidly in early-mid 2011 as the banking crisis escalated in the European PIIGS (Portugal, Ireland, Italy, Greece, Spain) and in particular during the Portuguese bailout and as Greece headed toward its second bailout. Spreads widened further and peaked in August-September 2011 with the US credit downgrade crisis when rating agency Standard & Poor’s took the radical step of stripping US government debt of its AAA rating. There was a fear the US government would default on its debts. The US government did indeed have to close down the government for a month in 2012 because it could not pay its bills. Credit spreads were at their highest since the 2008 sub-prime crisis.

The most recent peak in credit spreads and trough in share prices was in February 2016. Several factors were causing the general market pessimism, such as:

  • worries over the pace of US rate hikes and their possible impact on company profits and share prices
  • a possible hard landing in China, exacerbated by the crash in Chinese share prices
  • the escalation of oil/gas/steel bankruptcies
  • cracks in the European banking system led by fears of possible default by Deutsche Bank.

February 2016 compared with 2011

To me the level of fear and pessimism (measured by spreads) in 2016 was significantly over-done as conditions were not nearly as severe as they were in 2011. In mid-2011 we under-weighted shares in portfolios before they sold off heavily during the US downgrade crisis. This time, we did not take evasive action because it appeared that spreads (fear) had over-shot reality, and shares had been sold down too far.

Three key factors are likely to see spreads fall from their February 2016 levels and share prices stabilise and even recover:

  • the renewed resolve of the Chinese government to fund investment and credit to support growth (this was subsequently formalised at the National Congress in March)
  • the continued dominance of Fed Chair Janet Yellen over the ‘inflation hawk’ dissenters, and the resultant ‘go-slow’ on US interest rate hikes
  • the ECB’s continued commitment to negative rates and broadening QE in Europe.

These factors led to a degree of confidence that the sell-off in stock markets would probably not continue much longer or further, unlike in 2011 and 2008. Since mid-February, share prices have recovered a little while credit spreads have eased (tightened).

Credit spreads represent only one factor, but they can be a barometer that helps determine where we are in the share market cycle.


Ashley Owen (CFA, BA, LLB, LLM, Grad. Dip. App. Fin) has been an active investor since the mid-1980s, a senior executive of major global banking and finance groups, and currently advises HNW investors and advisory groups in Australia and Asia. This article is general information only and does not consider the personal circumstances of any individual. Readers should obtain their own advice before taking action.


4 Comments
Steven
May 13, 2016

The markets in the US are looking a lot like late 2007. S&P 500 is near all time highs, credit spreads on US high yield are double their recent lows. Let's see if this time is different.

ashley
May 12, 2016

Hi warren. Thanks for the feedback. I use Moody's credit spreads since the 1920s in my equity models. Fascinating to see how they work through the big market cycles - 1920s boom, 1930s depression, post war inflation, 1970s inflation, recessions in early 1980s and 1990s, tech wreck, sub-prime crash. The credit spread factor is one of the best factors in my US equity models that run portfolios for advisory groups and HNW. But the longer term picture is a bigger story for another day. Had to keep this story short and recent for the current audience.
cheers,
Ashley

Warren Bird
May 12, 2016

"Credit indices are literally full of the most indebted companies." That is the sort of comment that sounds obviously true, but actually isn't.

Most of the large components of credit indices are simply large companies. They issue a lot of debt, but their credit rating is solidly investment grade and they can carry their large amount of debt very comfortably. For instance, one of the largest issuers in the US corporate bond market is Apple, which is also one of the strongest credit risks in the universe of securities in the index. Among the other large issuers are the banks, heavily indebted by nature, but mostly strongly rated because of their capital management and credit risk processes. On the whole, the lower rated issuers are not the highest weighted in global credit indices.

Composition can make a difference, for sure, but if you're talking not just about narrower segments of the market (such as the high yield component in the example given) you will see that far more than if you are looking at broad market indices from AAA ratings all the way down the spectrum. The more diversified your universe, the better. (Where have I heard that before?)

Ashley, this was a useful overview. I remember the equity teams at Colonial First State were very appreciative of the Global Credit team's input during the GFC as the significance for equity prices of what was going on in credit markets became very apparent at that time. That was just before the charts you included, but going back a few more years would only reinforce what you've said.

Gary M
May 12, 2016

It is worth noting that credit indices have a very different composition to equity indices. Credit indices are literally full of the most indebted companies.
- Composition can make a big difference in index spreads - for instance European high yield and bank loan spreads blew out much less than their US counterparts due to much less energy sector exposure
- Companies can take actions (eg. increasing leverage) which can be viewed positively by equity markets and negatively by credit markets, and vice versa.


Leave a Comment:

RELATED ARTICLES

How dot plots and tiny triangles shape our investments

banner

Most viewed in recent weeks

2024/25 super thresholds – key changes and implications

The ATO has released all the superannuation rates and thresholds that will apply from 1 July 2024. Here's what’s changing and what’s not, and some key considerations and opportunities in the lead up to 30 June and beyond.

Five months on from cancer diagnosis

Life has radically shifted with my brain cancer, and I don’t know if it will ever be the same again. After decades of writing and a dozen years with Firstlinks, I still want to contribute, but exactly how and when I do that is unclear.

Is Australia ready for its population growth over the next decade?

Australia will have 3.7 million more people in a decade's time, though the growth won't be evenly distributed. Over 85s will see the fastest growth, while the number of younger people will barely rise. 

Welcome to Firstlinks Edition 552 with weekend update

Being rich is having a high-paying job and accumulating fancy houses and cars, while being wealthy is owning assets that provide passive income, as well as freedom and flexibility. Knowing the difference can reframe your life.

  • 21 March 2024

Why LICs may be close to bottoming

Investor disgust, consolidation, de-listings, price discounts, activist investors entering - it’s what typically happens at business cycle troughs, and it’s happening to LICs now. That may present a potential opportunity.

The public servants demanding $3m super tax exemption

The $3 million super tax will capture retired, and soon to retire, public servants and politicians who are members of defined benefit superannuation schemes. Lobbying efforts for exemptions to the tax are intensifying.

Latest Updates

Retirement

Uncomfortable truths: The real cost of living in retirement

How useful are the retirement savings and spending targets put out by various groups such as ASFA? Not very, and it's reducing the ability of ordinary retirees to fully understand their retirement income options.

Shares

On the virtue of owning wonderful businesses like CBA

The US market has pummelled Australia's over the past 16 years and for good reason: it has some incredible businesses. Australia does too, but if you want to enjoy US-type returns, you need to know where to look.

Investment strategies

Why bank hybrids are being priced at a premium

As long as the banks have no desire to pay up for term deposit funding - which looks likely for a while yet - investors will continue to pay a premium for the higher yielding, but riskier hybrid instrument.

Investment strategies

The Magnificent Seven's dominance poses ever-growing risks

The rise of the Magnificent Seven and their large weighting in US indices has led to debate about concentration risk in markets. Whatever your view, the crowding into these stocks poses several challenges for global investors.

Strategy

Wealth is more than a number

Money can bolster our joy in real ways. However, if we relentlessly chase wealth at the expense of other facets of well-being, history and science both teach us that it will lead to a hollowing out of life.

The copper bull market may have years to run

The copper market is barrelling towards a significant deficit and price surge over the next few decades that investors should not discount when looking at the potential for artificial intelligence and renewable energy.

Property

Global REITs are on sale

Global REITs have been out of favour for some time. While office remains a concern, the rest of the sector is in good shape and offers compelling value, with many REITs trading below underlying asset replacement costs.

Sponsors

Alliances

© 2024 Morningstar, Inc. All rights reserved.

Disclaimer
The data, research and opinions provided here are for information purposes; are not an offer to buy or sell a security; and are not warranted to be correct, complete or accurate. Morningstar, its affiliates, and third-party content providers are not responsible for any investment decisions, damages or losses resulting from, or related to, the data and analyses or their use. To the extent any content is general advice, it has been prepared for clients of Morningstar Australasia Pty Ltd (ABN: 95 090 665 544, AFSL: 240892), without reference to your financial objectives, situation or needs. For more information refer to our Financial Services Guide. You should consider the advice in light of these matters and if applicable, the relevant Product Disclosure Statement before making any decision to invest. Past performance does not necessarily indicate a financial product’s future performance. To obtain advice tailored to your situation, contact a professional financial adviser. Articles are current as at date of publication.
This website contains information and opinions provided by third parties. Inclusion of this information does not necessarily represent Morningstar’s positions, strategies or opinions and should not be considered an endorsement by Morningstar.