Register For Our Mailing List

Register to receive our free weekly newsletter including editorials.

Home / 150

Debt is the biggest risk on China’s horizon

There is an alarming rise in Chinese corporate debt and a steep rise in the early warning signs of creditor distress. China’s corporate debt has been the driver of China’s overall steep increase in debt to GDP. Global debt to GDP ratios have risen since the GFC, but in most other countries it is government sector that has been behind the rise, particularly in Europe and Japan. China is a special case as the governments often own the corporations, making the use of loans between state and corporations a greater risk to China’s overall economy.

This article looks at some of the specific drivers of corporate debt in China such as property, shadow banking and local government debt. But before we do that, here’s some further context on the world debt situation.

State-owned enterprise default

The most recent default, Dongbei Special, is a little-known steelmaker, but provides a great example of significant issues for the Chinese economy and therefore for Australian investors.

Dongbei Special is a state-owned enterprise that defaulted on USD131 million in debt underwritten by China Development Bank, another state-owned enterprise, on 28 March 2016. It owes a further USD150 million in short-term notes issued outside the banking sector, through shadow banking channels. A default of a local government-owned enterprise is rare, but likely to become an increasing problem particularly amongst parts of the economy, like steelmaking, that have been artificially propped up by government support and lending.

Global context

During the period 2007 to 2015, global debt (excluding banks) grew by around USD28 trillion. Nearly 33% of this was from China, and most of that was from the household and corporate sectors. A further 25% came from European governments and another 12% from the Japanese government.

The impact of these jumps in indebtedness was to rapidly increase the total debt ratios for these economies, but China’s growth in debt, albeit very steep, has only brought it in line with the US and Australia. Europe on the other hand has raced ahead of the US and China, and while still trailing Japan today, has already reached Japan’s total level of indebtedness in 2004.

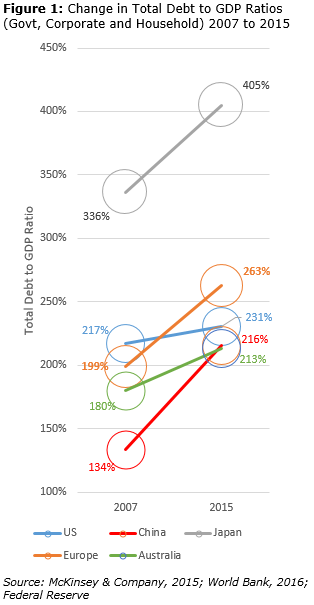
Given the current pace of growth in these economies, Japan and Europe are the greatest concerns. The US has had relatively little increase in total debt despite the massive government fiscal and monetary stimulus programs run during that time, simply because households and the corporate sector deleveraged over the same period. Figure 1 shows the pace of growth in China’s indebtedness.

Chinese debt is not unusually high in terms of its Total Debt to GDP Ratio. It is more or less the same as Australia. But recent growth rates have been very high and rising, and we need to question the sustainability of that credit growth and therefore China’s overall economic growth.

If Chinese growth stalls, there will be an immediate, negative flow on to the AUD, our share market, and particularly, resource stocks.

Pace of growth in China’s corporate and household debt

There are three primary causes of the sudden growth in private sector debt in China over the past eight years:

1. Property development

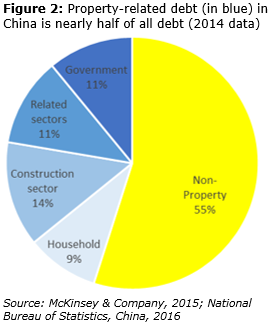
An estimated 45% of all Chinese debt is related to property. The mix is shown in Figure 2. Property construction alone represents 14% of all debt, and it is important to understand who the key lenders are to this sector.

China shows a very high level of overdevelopment, particularly in Tier 3 cities where the average time to sell developments is around 40% above historic levels.

The unusual figure in this chart is the 11% of total debt that is owed by local government entities for property or infrastructure projects, far higher than any other country.

2. Household exposure and shadow banking

Household debt has grown from USD1.0 trillion in 2007 to USD4.4 trillion in 2015. Mortgage debt makes up USD2.1 trillion of this, but small business related loans have jumped from $0.3 trillion to $1.4 trillion over the last eight years.

Again on a standalone basis this is not out of line with the rest of the world. Household debt in Australia, for example, is 113% of the GDP, in the US it is 77%, in Europe around 70%, and in Japan 65%, compared to just 38% in China.

What is more concerning is the household sector’s exposure to the property sector through ‘shadow banking’. Shadow banking simply refers to finance providers that typically take deposits from households and lend to businesses, including property developers, such as the debenture finance companies in Australia and New Zealand, such as Westpoint.

Shadow banking now accounts for USD6.5 trillion including around USD4.5 trillion from households, and is growing at twice the pace of the banking system and three times government debt growth rates. Again a slowdown in property would severely damage the economy, this time through consumer confidence and spending.

3. Local government debt

Local government debt has increased by 27% per annum since 2007 compared to 11% pa growth for central government debt. Local government debt now sits at USD2.9 trillion or around the same debt as the entire German government. More than 70% of this relates to property, as above. The key concern for these local government entities is the reliance on land sales to repay the debt, meaning that if the property cycle suddenly slows, many of these entities will be forced to refinance, placing considerable stress on the banking system, as much of this debt is via financing vehicles funded by the banks.

Strategy for investors

For Australian investors, this emerging debt situation must be watched carefully throughout 2016. It is becoming the largest threat to the Chinese economy. China’s health in turn is the largest threat to the Australian economy, its currency and its equity market. Investors looking to hedge their own wealth against a shock to the Chinese economy can either shift risky assets into safe harbour assets such as infrastructure bonds or equity; or they can place some of their Australian dollar positions into USD or GBP positions to profit from the falling AUD that would most likely follow any increase in risk relating to China’s indebtedness.


Craig Swanger is Senior Economist at FIIG Securities Limited, a leading fixed interest specialist. This article is general information and does not consider the circumstances of any individual.

Each year, FIIG Securities produces its Smart Income Report on the economic outlook and macro trends, and the 2016 version can be obtained on request, linked here.


1 Comments
Ashley
April 08, 2016

There is an upside in all of this – because most of the “corporate” debt in China is state-owned, and all of the major banks are state-owned, the problem can be solved by internal book entries between government agencies. It’s similar to Japan – sure the government debt level is high (260% of GDP, etc) but 95% of it is owned by government departments, agencies and funds, so it can be solved by internal ‘book entries’ between the debtor departments and creditor (debt owner) departments. There will be losers – mainly Japanese pensioners in DB schemes – but that is a domestic problem. Very different from US and Australia, etc – where most of the creditors (debt owners) are foreign. You can’t just do an internal book entry – you need to repay or default – which is nasty. Already the PBOC has outlined plans for banks to swap bad debts for equity in the defaulting borrowers – but this is just an internal book entry - the state (via the banks) ends up owning equity in the defaulting companies (also state-owned). So, the state ends up owning equity in the state-owned companies – which they do already now. There has been no change in the ultimate economic interest – state ownership of both debtors and creditors. Voila! – internal book entry and problem solved! In addition, the state is desperately keen to keep failing companies alive and employing people to keep them the populace happy and not rioting in the streets.


Leave a Comment:

RELATED ARTICLES

Three themes and companies to play China's rise

Is China’s regulatory reform stifling ‘animal spirits’?

China’s new model is a plan for a hostile world

banner

Most viewed in recent weeks

Australian house prices close in on world record

Sydney is set to become the world’s most expensive city for housing over the next 12 months, a new report shows. Our other major cities aren’t far behind unless there are major changes to improve housing affordability.

The case for the $3 million super tax

The Government's proposed tax has copped a lot of flack though I think it's a reasonable approach to improve the long-term sustainability of superannuation and the retirement income system. Here’s why.

7 examples of how the new super tax will be calculated

You've no doubt heard about Division 296. These case studies show what people at various levels above the $3 million threshold might need to pay the ATO, with examples ranging from under $500 to more than $35,000.

The revolt against Baby Boomer wealth

The $3m super tax could be put down to the Government needing money and the wealthy being easy targets. It’s deeper than that though and this looks at the factors behind the policy and why more taxes on the wealthy are coming.

Meg on SMSFs: Withdrawing assets ahead of the $3m super tax

The super tax has caused an almighty scuffle, but for SMSFs impacted by the proposed tax, a big question remains: what should they do now? Here are ideas for those wanting to withdraw money from their SMSF.

The super tax and the defined benefits scandal

Australia's superannuation inequities date back to poor decisions made by Parliament two decades ago. If super for the wealthy needs resetting, so too does the defined benefits schemes for our public servants.

Latest Updates

Planning

Will young Australians be better off than their parents?

For much of Australia’s history, each new generation has been better off than the last: better jobs and incomes as well as improved living standards. A new report assesses whether this time may be different.

Superannuation

The rubbery numbers behind super tax concessions

In selling the super tax, Labor has repeated Treasury claims of there being $50 billion in super tax concessions annually, mostly flowing to high-income earners. This figure is vastly overstated.

Investment strategies

A steady road to getting rich

The latest lists of Australia’s wealthiest individuals show that while overall wealth has continued to rise, gains by individuals haven't been uniform. Many might have been better off adopting a simpler investment strategy.

Economy

Would a corporate tax cut boost productivity in Australia?

As inflation eases, the Albanese government is switching its focus to lifting Australia’s sluggish productivity. Can corporate tax cuts reboot growth - or are we chasing a theory that doesn’t quite work here?

Are V-shaped market recoveries becoming more frequent?

April’s sharp rebound may feel familiar, but are V-shaped recoveries really more common in the post-COVID world? A look at market history suggests otherwise and hints that a common bias might be skewing perceptions.

Investment strategies

Asset allocation in a world of riskier developed markets

Old distinctions between developed and emerging market bonds no longer hold true. At a time where true diversification matters more than ever, this has big ramifications for the way that portfolios should be constructed.

Investment strategies

Top 5 investment reads

As the July school holiday break nears, here are some investment classics to put onto your reading list. The books offer lessons in investment strategy, financial disasters, and mergers and acquisitions.

Sponsors

Alliances

© 2025 Morningstar, Inc. All rights reserved.

Disclaimer
The data, research and opinions provided here are for information purposes; are not an offer to buy or sell a security; and are not warranted to be correct, complete or accurate. Morningstar, its affiliates, and third-party content providers are not responsible for any investment decisions, damages or losses resulting from, or related to, the data and analyses or their use. To the extent any content is general advice, it has been prepared for clients of Morningstar Australasia Pty Ltd (ABN: 95 090 665 544, AFSL: 240892), without reference to your financial objectives, situation or needs. For more information refer to our Financial Services Guide. You should consider the advice in light of these matters and if applicable, the relevant Product Disclosure Statement before making any decision to invest. Past performance does not necessarily indicate a financial product’s future performance. To obtain advice tailored to your situation, contact a professional financial adviser. Articles are current as at date of publication.
This website contains information and opinions provided by third parties. Inclusion of this information does not necessarily represent Morningstar’s positions, strategies or opinions and should not be considered an endorsement by Morningstar.