This is one of the many examples of a widely-held and seemingly logical belief about how investment markets work, that is in fact the opposite of what actually happens in real life.
In every city in every major country across the world, floors full of well-meaning (and expensive) economists, fund managers and analysts spend their lives assessing the outlooks for economic growth rates in the hope that it somehow translates into stock market returns. Whenever the World Bank, the IMF, OECD, central banks, or a major investment bank comes out with its latest economic forecasts, investors everywhere naturally try to understand what it may mean for share prices.
Good economic growth should be good for share prices, and low economic growth (or even worse, recessions) should be bad for share prices, right? Well, wrong actually. Most of the time, it’s the opposite in real life.
The ‘top down’ approach
There are many approaches to forming views about the outlook for share prices and whole stock markets. One of the main traditional and widely used approaches is the ‘top down’ method. This starts with the global economic outlook and then the outlooks for regions, countries, sectors, industries, and then individual companies.
It is all based on the quite logical assumption that economic growth drives (or is caused by, or at least coincides with) company earnings growth, and that earnings drive stock prices. Or at least expectations of economic growth and expectations of earnings drive stock prices. Or perhaps even that expectations of likely changes in economic growth rates drive stock prices directly.
Of course there are many links between economies and company earnings. After all, what makes up the ‘economy’ is individuals, firms and governments receiving and spending money; buying, selling, exporting and importing goods and services; saving, investing, borrowing, employing people, etc, - and listed companies are involved in almost all stages of these activities that make up the economy. So it would make sense that increases or decreases in economic activity should affect listed company earnings and share prices.
The problem is that none of these assumptions hold true very often. In fact in most years and in most countries the opposite is the case.
There is no exploitable statistical relationship between economic growth rates and stock market returns, either at a global level or in individual countries, or indeed individual companies. We will look at the global picture first, since economies are highly interconnected and stock markets are also highly correlated.
Global economic growth versus global equities returns
Only rarely do above average world economic growth rates coincide with, cause or result from, above average stock market returns. In only 2 years in the past 32 years since 1980 has this been the case – 1988 and 2006.
Likewise, in only 5 years have below average world economic growth rates coincided with, caused or resulted from, below average stock market returns – 1981, 1990, 1992, 2001 & 2002.
In fact at least half of the time when economic growth was above average, stock market returns were below average, and at least half of the time when economic growth was below average (including in global recessions), stock market returns were above average.
This can be seen in the following chart of world real GDP growth and world stock market total returns (ie price changes plus dividends) for each year since 1980:
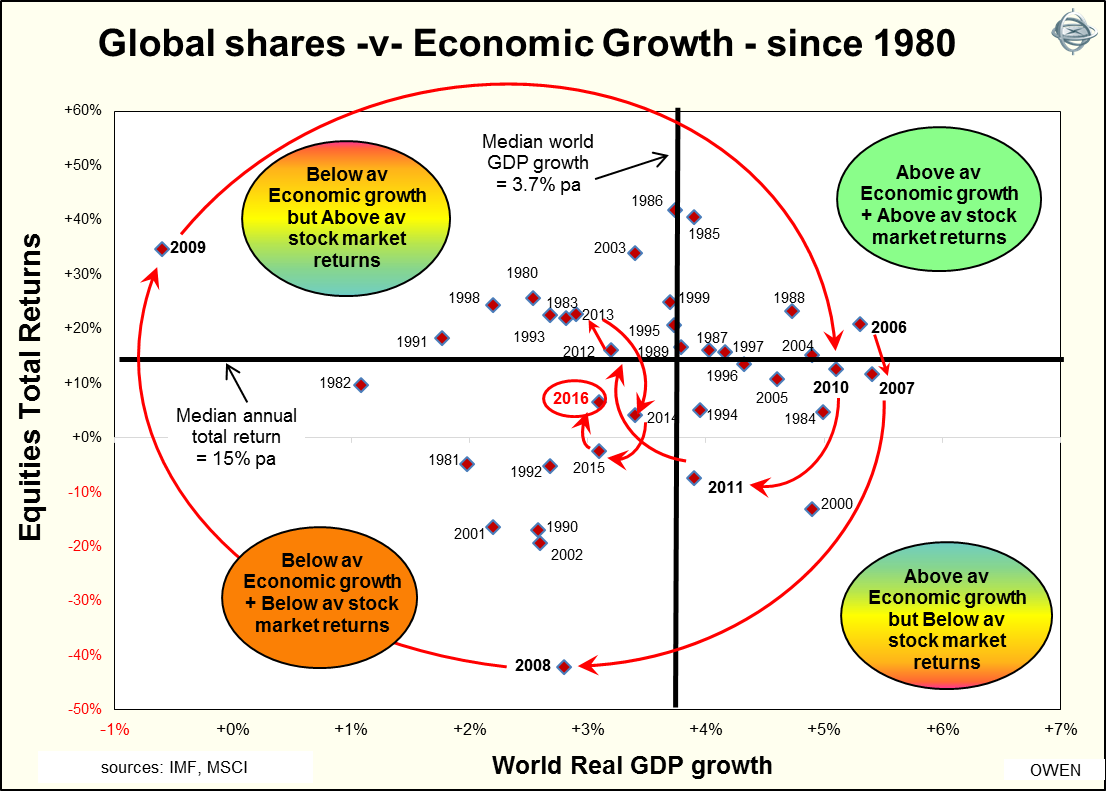
If economic growth rates coincided with, caused or resulted from, or somehow translated into stock market returns then most years would be in either the top right segment (above average economic growth + above average stock market returns) or in the lower left segment (below average economic growth + below average stock market returns). But in real life this has not been the case.
For example 2012 was similar to several other years in the recent past – when economic growth was below average but stock market returns were above average. This followed 2011 when economic growth was above average (3.9% compared to a 30 year average of 3.7%) but stock market returns were very poor and well below average.
Going back further, in 2009 world economic growth contracted in the deepest global recession since the 1930s depression, but shares had a great year in 2009 and the world stock market index was up by 29%!
Individual countries
There is a similar story when looking at cross sectional returns in individual countries in any particular year.
For example, in 2011 economies almost everywhere grew (except Japan with its tsunami/nuclear crisis), overall global growth was above its long term average, and earnings and dividends grew strongly in most of the major countries. But almost all stock markets were down heavily that year, despite the good growth in economies, earnings and dividends.

In 2011 the highest growth economies (China, India, Turkey) had the worst stock market returns. Of those very few major stock markets that had positive total returns in 2011, only Indonesia posted price gains. In the others (US, Thailand, Pakistan and South Africa) the broad market price index fell, but the addition of dividends helped them just scrape into positive total return territory, while Malaysia was flat.
Then in 2012 the situation reversed. Economic growth rates were lower and earnings growth stopped or fell in most countries (including in most of the big markets), but stock markets in almost every country boomed.

Nearly all stock markets were up for the year while economic growth was patchy. US growth was sub-trend, and Europe drifted in and out of recession, with significant contractions in the PIIGS, and yet share prices rocketed up almost everywhere.
Conversely, the highest economic growth rate was in China, which once again had one of the worst stock market returns. The worst economy was Greece, which had one of the best performing stock markets that year (up 33% plus dividends!).
(2012 was one of those very rare years when every asset class did well - shares, commercial property, every type of bond market - government, corporate, high yield, emerging market and inflation-linked, and even gold was up 6%. These great returns across every asset class were achieved despite rolling recessions and high unemployment in the developed markets, slowing growth in the BRIC markets, escalating currency wars, rising political and social unrest across the world, troubling military tensions in north Asia, plus the odd nuclear scare thrown in for good measure from Iran and North Korea).
The relationship between economic growth and stock market returns is so perverse that the regular economic outlook statements from the World Bank and the IMF have almost become contrary indicators. Whenever they lower their global growth outlooks it is usually followed by good returns, and vice versa.
There are examples of this everywhere. Every time US Fed Chairman Ben Bernanke declared that the US economy was so weak it had to be put on life support (in the form of QE-1, QE-2, Operation Twist, QE-3, QE-4, etc) investors rejoiced and stock and bond markets in the US and around the world boomed. But in late May 2013, when suggested that the US economy is strengthening to the point where it can now be taken off life support, stock and bond markets fell heavily in the US and everywhere else as investors panicked and ran for the exits. The last thing investors want is a strong economy!
Closer to home, last week the Australian stock market just finished its best financial year since the pre-GFC boom (with total returns of 21% for the 12 months to June 2013), despite aggregate earnings falling over the year. Earnings for the Australian market peaked in the 2010-11 financial year, and since then total earnings have fallen by 8% but total returns have gained 12%. We will look at the relationship between economic growth, earnings and share prices for Australia in more detail in future articles.
In conclusion, links between economic growth, company earnings and share prices are not as simple and as straightforward as assuming that higher (or lower) economic growth leads to higher (or lower) share prices. Like most things in life, timing is everything, but that’s another story for another day.
Ashley Owen is Joint Chief Executive Officer at Philo Capital Advisers.