Register For Our Mailing List

Register to receive our free weekly newsletter including editorials.

Home / 185

Exchange traded products in 2016 and a look ahead

With the silly season upon us, it’s the perfect time to reflect on 2016. It’s been a big year for Exchange Traded Products (ETPs) in Australia and around the world, and it’s worth looking at likely developments as we move into 2017 and beyond.

Australia

At the beginning of the year, the ETP industry had about $21.4 billion in assets under management (AUM) across 169 funds. As at the end of October 2016, ETPs had grown to $24.4 billion in AUM across 199 products. An impressive 30 funds have been launched this year as at October end, and there are currently 5 ETPs that have over $1 billion of AUM in the local market.

There have been some major shocks to the global markets in 2016, but the Australian share market is marginally higher than at the beginning of 2016 and may finish even stronger if the late momentum carries on until the end of the year.
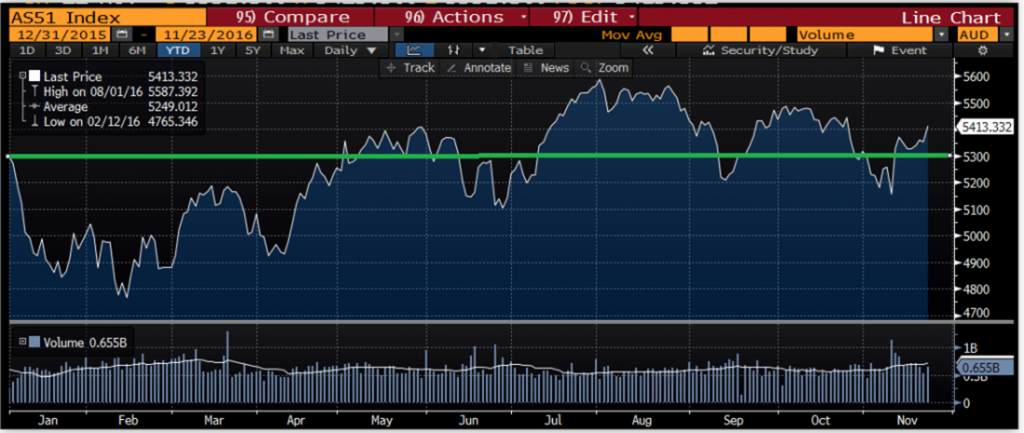
Source: Bloomberg

In addition to the 16% AUM growth in ETPs for the last 12 months to October 2016, we also saw record high trading activity levels, up 18% on the previous year. The three biggest increases in AUM occurred across Australian equities, international equities and fixed income products. Strong inflows have continued in reaction to President-Elect Trump’s business-friendly stance and expansionary fiscal policy. There were very little outflows overall for the year, but what did flow out was mostly Asian equities (ex-Japan).

Global

The global ETP industry also produced stellar results for the year to date, although obviously on a much larger scale. According to ETP industry researcher, ETFGI, global ETP assets reached a record US$3.4 trillion at the end of the Q3 2016, about 10% larger than the global hedge fund industry (US$2.9 trillion), after experiencing 32 consecutive months of net inflows.

In the first three quarters of 2016, ETPs saw net inflows of US$238 billion, which is down slightly from the US$252 billion gathered at the same point in 2015. Fixed income ETPs gained the largest net inflows with US$101 billion, which is a record level of YTD net new assets and significantly above the prior YTD record of US$64 billion set in 2015. After fixed income, the next biggest categories for inflows were equity ETPs with US$86 billion and commodity ETPs with US$37 billion.

As at the end of October 2016, there were 6,526 ETPs (+511) issued by 284 providers, being traded on 65 exchanges across 53 countries. These international numbers are truly mind-boggling.

The future

Over 2017, the Australian ETP market is likely to see growth in:

  • Factor based products: not exactly active, and not just passive, these ETPs weight by factors other than market cap with the intention of producing alpha by breaking the link between price and portfolio weight.
  • Hedged exposures: whilst the AUD has proven resilient over the year, not dropping close to most analysts’ expectations, money has been made on unhedged exposures. In regions such as Europe and Japan, equity markets have historically performed best when their currency is falling, so it is prudent to take a look at exposures hedged and unhedged and select what suits. More options will allow exposures both hedged and unhedged in the Australian market.
  • Active exchange traded managed funds: with the success and acceptance of these products in 2016, many more active managers will consider listed versions of their funds in 2017.
  • Fixed income products: despite new products, there is room for more with different types of risk.

It was a year of ups and downs for markets generally, but ETPs continued to grow in size and range. Australia has a lot of catching up to the rest of the world in the variety of ETPs, so expect many new products in 2017.


Justin Arzadon is Associate Director, Distribution at BetaShares. This article is general information and does not consider the specific circumstances of any individual. BetaShares is a sponsor of Cuffelinks.


Leave a Comment:

RELATED ARTICLES

The challenges of building a lazy portfolio

Where is peak ETF?

ASA’s view on the banning of LIC commissions

banner

Most viewed in recent weeks

The case for the $3 million super tax

The Government's proposed tax has copped a lot of flack though I think it's a reasonable approach to improve the long-term sustainability of superannuation and the retirement income system. Here’s why.

7 examples of how the new super tax will be calculated

You've no doubt heard about Division 296. These case studies show what people at various levels above the $3 million threshold might need to pay the ATO, with examples ranging from under $500 to more than $35,000.

The revolt against Baby Boomer wealth

The $3m super tax could be put down to the Government needing money and the wealthy being easy targets. It’s deeper than that though and this looks at the factors behind the policy and why more taxes on the wealthy are coming.

Meg on SMSFs: Withdrawing assets ahead of the $3m super tax

The super tax has caused an almighty scuffle, but for SMSFs impacted by the proposed tax, a big question remains: what should they do now? Here are ideas for those wanting to withdraw money from their SMSF.

The super tax and the defined benefits scandal

Australia's superannuation inequities date back to poor decisions made by Parliament two decades ago. If super for the wealthy needs resetting, so too does the defined benefits schemes for our public servants.

Are franking credits hurting Australia’s economy?

Business investment and per capita GDP have languished over the past decade and the Labor Government is conducting inquiries to find out why. Franking credits should be part of the debate about our stalling economy.

Latest Updates

Superannuation

Here's what should replace the $3 million super tax

With Div. 296 looming, is there a smarter way to tax superannuation? This proposes a fairer, income-linked alternative that respects compounding, ensures predictability, and avoids taxing unrealised capital gains. 

Superannuation

Less than 1% of wealthy families will struggle to pay super tax: study

An ANU study has found that families with at least one super balance over $3 million have average wealth exceeding $19 million - suggesting most are well placed to absorb taxes on unrealised capital gains.   

Superannuation

Are SMSFs getting too much of a free ride?

SMSFs have managed to match, or even outperform, larger super funds despite adopting more conservative investment strategies. This looks at how they've done it - and the potential policy implications.  

Property

A developer's take on Australia's housing issues

Stockland’s development chief discusses supply constraints, government initiatives and the impact of Japanese-owned homebuilders on the industry. He also talks of green shoots in a troubled property market.

Economy

Lessons from 100 years of growing US debt

As the US debt ceiling looms, the usual warnings about a potential crash in bond and equity markets have started to appear. Investors can take confidence from history but should keep an eye on two main indicators.

Investment strategies

Investors might be paying too much for familiarity

US mega-cap tech stocks have dominated recent returns - but is familiarity distorting judgement? Like the Monty Hall problem, investing success often comes from switching when it feels hardest to do so.

Latest from Morningstar

A winning investment strategy sitting right under your nose

How does a strategy built around systematically buying-and-holding a basket of the market's biggest losers perform? It turns out pretty well, so why don't more investors do it?

Sponsors

Alliances

© 2025 Morningstar, Inc. All rights reserved.

Disclaimer
The data, research and opinions provided here are for information purposes; are not an offer to buy or sell a security; and are not warranted to be correct, complete or accurate. Morningstar, its affiliates, and third-party content providers are not responsible for any investment decisions, damages or losses resulting from, or related to, the data and analyses or their use. To the extent any content is general advice, it has been prepared for clients of Morningstar Australasia Pty Ltd (ABN: 95 090 665 544, AFSL: 240892), without reference to your financial objectives, situation or needs. For more information refer to our Financial Services Guide. You should consider the advice in light of these matters and if applicable, the relevant Product Disclosure Statement before making any decision to invest. Past performance does not necessarily indicate a financial product’s future performance. To obtain advice tailored to your situation, contact a professional financial adviser. Articles are current as at date of publication.
This website contains information and opinions provided by third parties. Inclusion of this information does not necessarily represent Morningstar’s positions, strategies or opinions and should not be considered an endorsement by Morningstar.