Register For Our Mailing List

Register to receive our free weekly newsletter including editorials.

Home / 222

Five fundamental investing lessons

As Warren Buffett once said: “There seems to be a perverse human characteristic that makes easy things difficult.” This has particularly been the case with investing where complexity has multiplied with new products, new ways to access various investments, tax changes and new regulations, all with social media adding to the noise. But it’s really quite simple and this can be demonstrated in these charts and table.

#1 Time in the market versus timing the market
Source: Bloomberg, AMP Capital

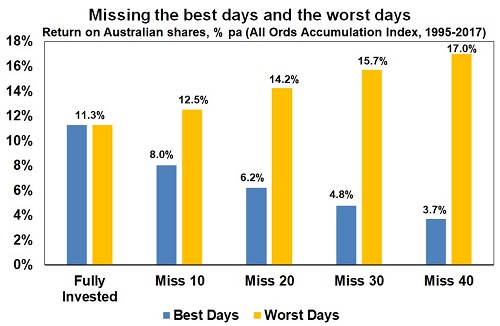
Without a tried and tested asset allocation process, trying to time the market, i.e. selling in anticipation of falls and buying in anticipation of gains, is very difficult. A good way to demonstrate this is a comparison of returns if an investor is fully invested in shares versus missing out on the best (or worst) days. If you were fully invested in Australian shares from January 1995, you would have returned 11.3% per annum (including dividends but not franking credits, tax and fees).

If by trying to time the market you avoided the 10 worst days (yellow bars), you would have boosted your return to 12.5% pa. If you avoided the 40 worst days, it would have been boosted to 17% pa. But this is difficult and many investors get out after the bad returns have occurred, just in time to miss some of the best days. For example, if you miss the 10 best days (blue bars), the return falls to 8% pa. If you miss the 40 best days, it drops to just 3.7% pa.

Key message: market timing is great if you can get it right, but without a tested process, the risk of getting it wrong is very high and if so it can destroy your returns.

#2 Look at your investments less
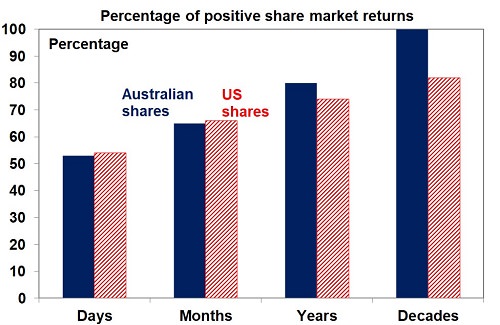
Daily and monthly data from 1995, data for years and decades from 1900.

Source: Global Financial Data, AMP Capital

The daily movements in the share market are down almost as much as they are up, with slightly over 50% of days seeing positive gains. See the next chart for Australian and US shares. Day-by-day, it’s pretty much a coin toss whether you will get good news or bad news. But if you only look monthly and allow for dividends, the historical experience tells us you will only get bad news around a third of the time. Looking out further on a calendar year basis, data back to 1900 indicates the probability of a loss slides to just 20% in Australian shares and 26% for US shares. And if you go all the way out to once a decade, since 1900 positive returns have been seen 100% of the time for Australian shares and 82% for US shares.

Key message: the less you look at your investments, the less you will be disappointed. This matters because the more you are disappointed, the greater the chance of selling at the wrong time.

#3 Understand risk and return potential
Source: AMP Capital

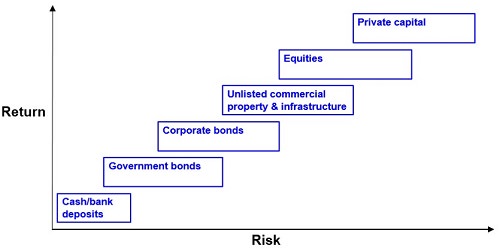
This chart is basic to investing. Each asset class has its own risk (in terms of volatility and risk of loss) and return characteristics. Put simply: the higher the risk of an asset, the higher the return you will likely achieve over the long term and vice versa. The next chart shows a stylised version of this. Each step up involves more risk and this is compensated for with more return.

Key message: Investors who don't mind short-term risk (and illiquidity in the case of unlisted assets) can take advantage of the higher returns growth assets offer over long periods, but there is no free lunch.

#4 The value of diversification

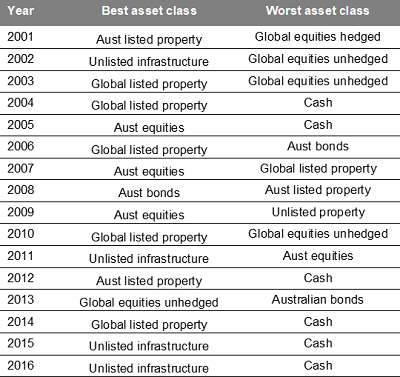
But this is not the end of the story. The next table shows the best and worst performing asset class in each year over the last 15 years.
Source: Thomson Reuters, AMP Capital

The best-performing asset each year varies with no pattern and last year’s top performer is no guide to the year ahead. For example, those who loaded up on listed property after their strong pre-GFC performances were badly hurt as they were amongst the worst-performing assets through the GFC. It makes sense to have a combination of asset classes in your portfolio, especially assets that are lowly correlated i.e. that don't just move in lock step with each other.

Key message: diversification is like the magic of compound interest, since a well-diversified exposure means your portfolio won't be as volatile. This can help you stick to your strategy when the going gets rough.

#5 The power of compounding (and residential property has a role)
Source: ABS, REIA, Global Financial Data, AMP Capital

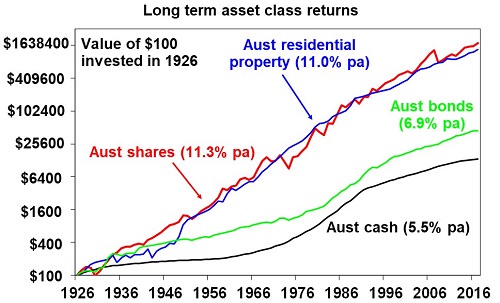
This chart highlights the power of compound interest, with a comparison showing the value of $100 invested in various Australian asset classes since 1926.

Over very long periods, the power of compounding works wonders for shares compared to bonds and cash. But it can also be seen to work well for Australian residential property with an average total return (capital growth plus net rental income) of 11% pa, which is similar to that for shares (while acknowledging that it's difficult to generalise about residential prices as every property is unique).

The key is to allow for the different ‘risks’ experienced by property versus shares. Property prices are less volatile than share prices as they are not traded on share markets and so are not as subject to the whims of investors. Movements in their values tend to relate more to movements in the real economy. But residential property takes longer to buy and sell and it’s harder to diversify as you can’t easily have exposure to hundreds or thousands of properties in different sectors and countries like you can with shares.

Key message: Given their long-term returns and diversification benefits, there is a key role for residential property in an investment portfolio (putting aside issues of current valuations).


Dr Shane Oliver is Head of Investment Strategy and Chief Economist at AMP Capital. This article is general information and does not consider the circumstances of any investor.


  •   12 October 2017
  • 7
  •      
  •   
7 Comments
Gary
October 12, 2017

The ‘missing the best/worst days in the market’ are based on day-end closing prices and NOBODY gets day-end closing prices. There have been other studies that have shown that using VWAP (volume weighted average prices) gives different results. They also assume you can sell at the day-end close price the day before a ‘bad day’, then buy it back again at the day-end close price the day after the bad day, etc. It is not possible.

SMSF Trustee
October 12, 2017

Lots of investors get end of day closing prices when they transact. They're called unit trust investors and last time I looked it was a popular way of getting exposure to markets.

Technically you make some valid points, Gary, for those who don't get end of day prices. But Shane, working for a large provider of unit trusts, would be quite comfortable with his approach, I'm sure.

Phil Brady
October 12, 2017

I always find these articles interesting in that they never mention valuation as a key need for successful investing or that starting points matter, even over longer time periods.

Aaron
October 12, 2017

Shane, some good point here for growing a portfolio over time.
It's also worth thinking about the impact of inflation, especially for point 2. While the 1970s was a positive decade for returns, investors suffered under high inflation and were worse off at the end of the decade. A previous piece by Jeremy Cooper (
http://cuffelinks.com.au/spinning-the-wheel-in-retirement/ ) highlights the variability from equity investing even over 20 year periods. Just because the return is expected to be positive, it doesn't mean that equities always outperform.
The key is to have an investment strategy that enables the volatile investment to stay in the market. This is harder for retirees who need to draw an income, but a good framework will manage the essentials first and allow the rest of the portfolio to grow.

Steve Martin
October 12, 2017

As might always be expected from Shane Oliver, this is an excellent article, very interesting and it reinforces sage advice on investing. Despite the nit pickery of some, it is clearly not intended to be an exhaustive tome on investing wisdom; it sets out simple principles which are undoubtedly correct and very useful to those of us trying to manage our investments. I, and I suspect the vast majority of the readers, are grateful that people of the calibre of Shane take the time to contribute these articles.

Jacie
October 14, 2017

Agree 100%. It's comments like these that emphasise the website's needs for a "like" or "upvote" button, so that others can easily agree with what you have said.

Brett
October 16, 2017

Can't help but think that clustering will have an effect here...

In other words, when the bull market becomes very mature, like now, we aren't having too many of the "best days"... The balance of risks therefore shift to a far greater likelihood of some of the "worst days" then of having "best days", and many investors would be wise to reduce risk by reducing equity allocation (perhaps significantly) and waiting for a cluster of "worst days" before buying in and hoping that the "worst days" are getting less likely, eventually giving way to some "best days"....

Basically why Shiller is saying what he has begun to say in his recent essay...

Blind dollar cost averaging may be good for fund managers but not really for investors, and Mr Buffett does not appreciate fund managers becoming wealthy irrespective of whether their co-investors do well...


Leave a Comment:

RELATED ARTICLES

Don't let Trump derail your wealth creation plans

The BIG picture: portfolios perform for the passive and patient

A one-page introduction to investing

banner

Most viewed in recent weeks

How to minimise tax with a will

Inheritance tax implications in Australia may surprise some, as poor estate planning without proper wills or trusts can lead to costly tax bills and delays for beneficiaries.

Testamentary trusts post-budget: Estate planning, tax reform and the ‘death tax’ debate

Proposed Budget changes to taxation are casting new uncertainty over testamentary trusts, prompting closer scrutiny of estate planning structures and the real implications of reforms still taking shape.

Meg on SMSFs: The CGT changes don’t impact super but what about Div 296 tax decisions?

New CGT rules could tip the scales in the super vs non-super debate. For those facing the Division 296 tax, the case for withdrawing has gotten more complex. A "comparison rate" tool may help assess decisions.

High quality businesses are on sale

Beneath the dominance of the ASX's largest stocks, much of the market has been left behind. High-quality companies are now trading at levels rarely seen, offering opportunities for investors willing to look deeper.

The strange effect of the 30% minimum capital gains tax

The 30% minimum tax on capital gains sits at the heart of the budget's proposed reforms. Yet the mechanics reveal anomalies that introduce unexpected distortions that raise questions about its design.

Welcome to Firstlinks Edition 667 with weekend update

The downfall of the giant and three lessons for investors.

  • 18 June 2026

Latest Updates

Latest from Morningstar

Ranking three common retirement strategies

The defining challenge of retirement isn't just about building wealth, it's about converting your lifetime savings into sustainable income. A holistic understanding of different strategies can improve long-term outcomes.

Economy

Was life really better in the good old days?

Are we worse off than previous generations? Lately, there seems to be a heightened level of angst that economic conditions are getting harder and that the two-party political system (and maybe democracy too) is failing voters.

Retirement

Australia has saved $4.5 trillion for retirement. Here's what matters more

Most Australians approaching retirement can tell you the exact dollar value of their super account. But success depends on more than a sizeable balance. Here's four key questions to ask yourself at the start of the financial year. 

Who gains in an AI-supercharged economy?

AI is already reshaping the economy, but companies building transformative technologies rarely capture the greatest long-term value. Instead, those benefits accrue to the users. We may well see this pattern reproduced. 

Taxation

Div 296's million-dollar reset worth $25,000

The 'cost base reset' for the new super tax is being sold as protection for pre-July gains. A worked example shows $1M of protection is worth about $25,000, and the real deadline has not passed.

Latest from Morningstar

The forecasting fix that Wall Street missed

Asking whether markets are overpriced may be the wrong question. New research suggests that traditional valuation metrics used to forecast returns may have been misread. Here are five takeaways for investors.

Investment strategies

Should a fund manager invest their own money differently?

Investors often like the idea that fund managers should invest client money exactly as they invest their own. But reality is more complicated. Unique circumstances make a different approach rational and, at times, beneficial.

Sponsors

Alliances

© 2026 Morningstar, Inc. All rights reserved.

Disclaimer
The data, research and opinions provided here are for information purposes; are not an offer to buy or sell a security; and are not warranted to be correct, complete or accurate. Morningstar, its affiliates, and third-party content providers are not responsible for any investment decisions, damages or losses resulting from, or related to, the data and analyses or their use. To the extent any content is general advice, it has been prepared for clients of Morningstar Australasia Pty Ltd (ABN: 95 090 665 544, AFSL: 240892), without reference to your financial objectives, situation or needs. For more information refer to our Financial Services Guide. You should consider the advice in light of these matters and if applicable, the relevant Product Disclosure Statement before making any decision to invest. Past performance does not necessarily indicate a financial product’s future performance. To obtain advice tailored to your situation, contact a professional financial adviser. Articles are current as at date of publication.
This website contains information and opinions provided by third parties. Inclusion of this information does not necessarily represent Morningstar’s positions, strategies or opinions and should not be considered an endorsement by Morningstar.