In my last article I explained how real returns are the most crucial measure of investment outcomes for an individual saving for retirement. It follows that the crucial measure of risk is the volatility of real returns. Yet most super funds do not explicitly manage for real returns and real return risk. Regulators and industry reviews provide little guidance on this issue and super fund trustees need to provide greater leadership on this important issue.
One possible explanation for the focus on nominal return outcomes is that the Superannuation Guarantee was created around the same period as the RBA introduced inflation targeting. Over this period inflation has been relatively low and consistent. In such an environment the volatility of real returns will be similar to the volatility of nominal returns and so the need to manage real return risk may not be apparent. What we need to consider is the risk that inflation will not always be consistently low. This article explores real outcomes using a much longer data set.
What was worst period for performance?
To illustrate, a trivia question: Over the last 100 years, assuming we maintained similar asset mix to that used in portfolios today (30% Australian equities, 30% global equities, 30% Australian nominal bonds and 10% cash), what would have been the worst period for performance of retirement savings? Many of us might say the Global Financial Crisis or the Great Depression, but both answers are wrong. You would have been on the money if you were thinking about nominal returns, but if you are focused on real outcomes, the driver of retirement outcomes, then the story is quite different. In the chart below I illustrate both real and nominal outcomes in terms of drawdown (the largest cumulative loss experienced in account value, both nominal and real). Because this chart only focuses on cumulative losses, it cannot go above zero.
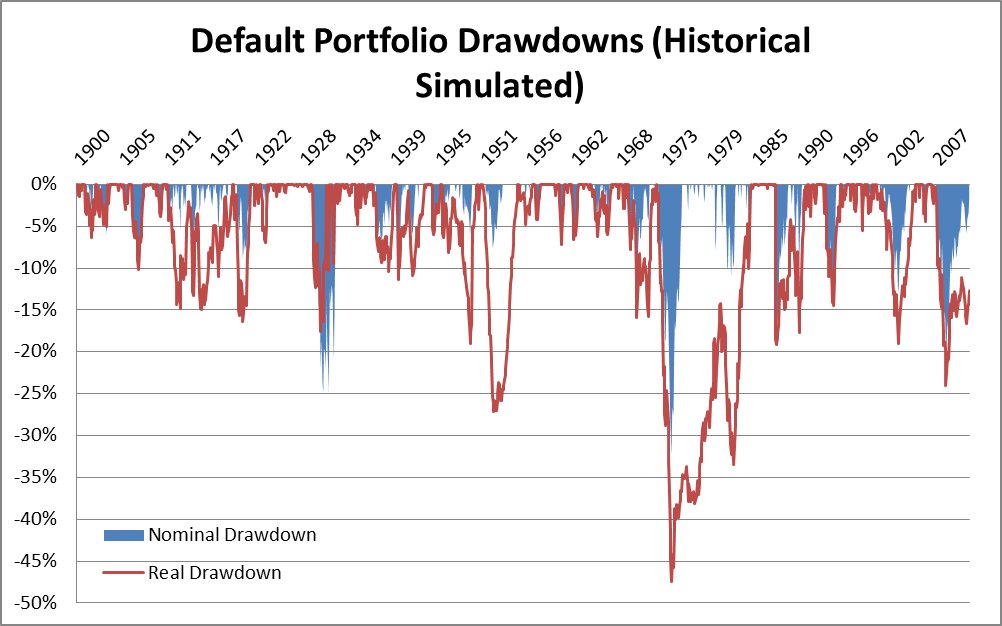
Diagram 1: Simulated historical drawdowns for default portfolios (nominal and real outcomes). Source: Schroders; “Why SAA is Flawed,” March 2012, Schroder Investment Management Australia
Diagram 1 illustrates the significant effect inflation can have on retirement financial outcomes. We see this clearly by observing that the worst periods for retirees (measured by the cumulative loss in the purchasing power of their retirement savings) would generally have been periods when inflation was very high and assets failed to keep up in real terms (or worse still, performed negatively in nominal returns). This explains why the 1970’s would historically have been the worst period for those saving for retirement. So while the GFC and Great Depression were poor outcomes they are also-rans once prevailing inflation outcomes are considered. The GFC ranked the third largest drawdown in real terms and the Great Depression seventh. Indeed deflation during the Great Depression would have partly offset the loss of purchasing power due to poor nominal performance.
The chart above does suggest a fair amount of volatility. Let’s look at this more closely and investigate how a default portfolio would have performed historically. Table 1 below summarises the outcomes.
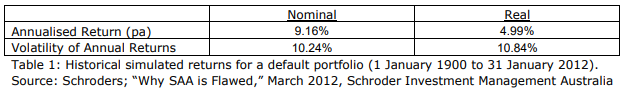
It should not surprise that real returns are lower than nominal returns. But remember that the compounding of savings would be much slower in real terms than nominal returns.
Focus on real returns
It is interesting however to observe that the volatility of real returns is greater than the volatility of nominal returns; not by a huge amount, but higher nonetheless. Why is this? Firstly, volatility of real returns includes the effects of another source of variability, namely inflation outcomes, which is not directly captured when calculating the volatility of nominal outcomes. And secondly, the assets most commonly used in default funds (cash, nominal bonds, Australian and international equities) may not collectively always perform strongly when inflation is high. Unfortunately in this case the numbers don’t tell the full story. When it comes to real return outcomes there has historically been a greater tendency for ‘bad years’ to clump together (historically there have been times when once inflation creeps in it is hard to shake out). We can see this by looking back at the 1970’s period in Diagram 1.
This highlights the fallacy of super funds managing nominal return risk: by focusing on the wrong objective (nominal return and risk), members of super funds are exposed to a higher level of retirement outcome risk than they and the trustees of their super funds may think.
Can we rely on the current default portfolio asset mix to reliably deliver real returns? Unfortunately the answer is probably no. While Table 1 suggests that the average annualised real return would have historically been around 5% (before fees and other expenses; though generally this would be regarded as quite an acceptable level of gross real returns), the volatility of outcomes, the observation of outsized losses relative to what the volatility may suggest (indicating that returns may be skewed to the downside), and the observation that periods of bad real outcomes can clump together, create a historical picture where poor outcomes would have been experienced, even over long time frames. This is illustrated in Diagram 2 below where we look at historical rolling ten-year return outcomes.
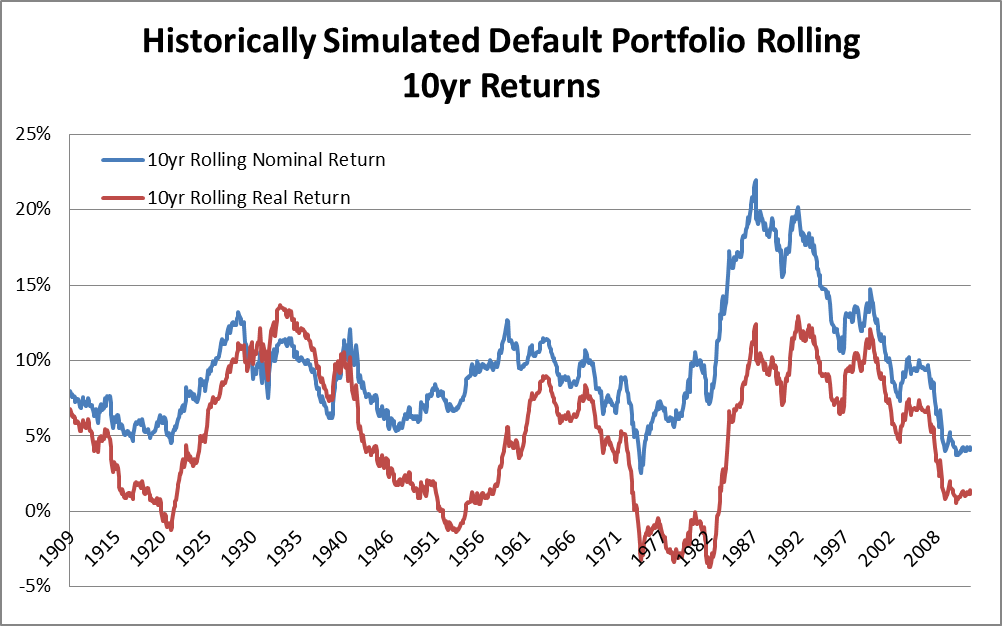
Diagram 2: Simulated historical 10 year rolling returns (nominal and real) for a default portfolio asset allocation. Source: Schroders; “Why SAA is Flawed,” March 2012, Schroder Investment Management Australia.
We see that nominal return outcomes over rolling ten-year periods have always been positive and generally above 5%. The same cannot be said for real returns where we see some instance of negative rolling ten-year outcomes. If we think about cohorts of members retiring at different times then return sequencing risk becomes an issue (see Cuffelinks 6 March 2013 for an introduction). It is reasonable to question whether this variability in outcomes is appropriate for retirement savings.
Summary
Superannuation funds, financial planners and individuals think of the variability of nominal returns as the risk that needs to be managed. Most do not manage the variability of real returns, yet it is real outcomes which are most important to those saving for retirement and those living off their retirement savings. No risk can be managed effectively unless it is specifically targeted.
So how can we manage real return risks more directly? This is the topic of my next article.