Register For Our Mailing List

Register to receive our free weekly newsletter including editorials.

Home / 64

Impact of deficits and surpluses on stock market returns

In Part 1, we looked at the record of Labor versus Liberal governments in running surpluses or deficits. Both sides have run very few government surpluses during their respective years since Federation.

In Part 2, we looked at the record of Labor versus Liberal governments in running up (and occasionally paying off) government debt. We saw that the current level of Commonwealth government debt (relative to national income) is modest, and is lower than almost any other time since World War 1. It is also lower than almost all other countries today.

Part 3 looks at what government deficits mean for share markets.

As investors we are not concerned here with debates about whether deficits are inherently good or bad, nor about inter-generational equity between current and future taxpayers, etc. We are primarily interested in the returns from shares in different fiscal conditions.

Chart 1 shows the annual Federal government balance plotted against real total returns from shares (including re-invested dividends and after CPI inflation). These are for years ending in June so they line up with the government’s fiscal years. Labor government years are shown in red and right-leaning government years (including Liberal) are shown in blue.

Chart 1: Federal government surplus/deficit versus real total returns from shares since Federation

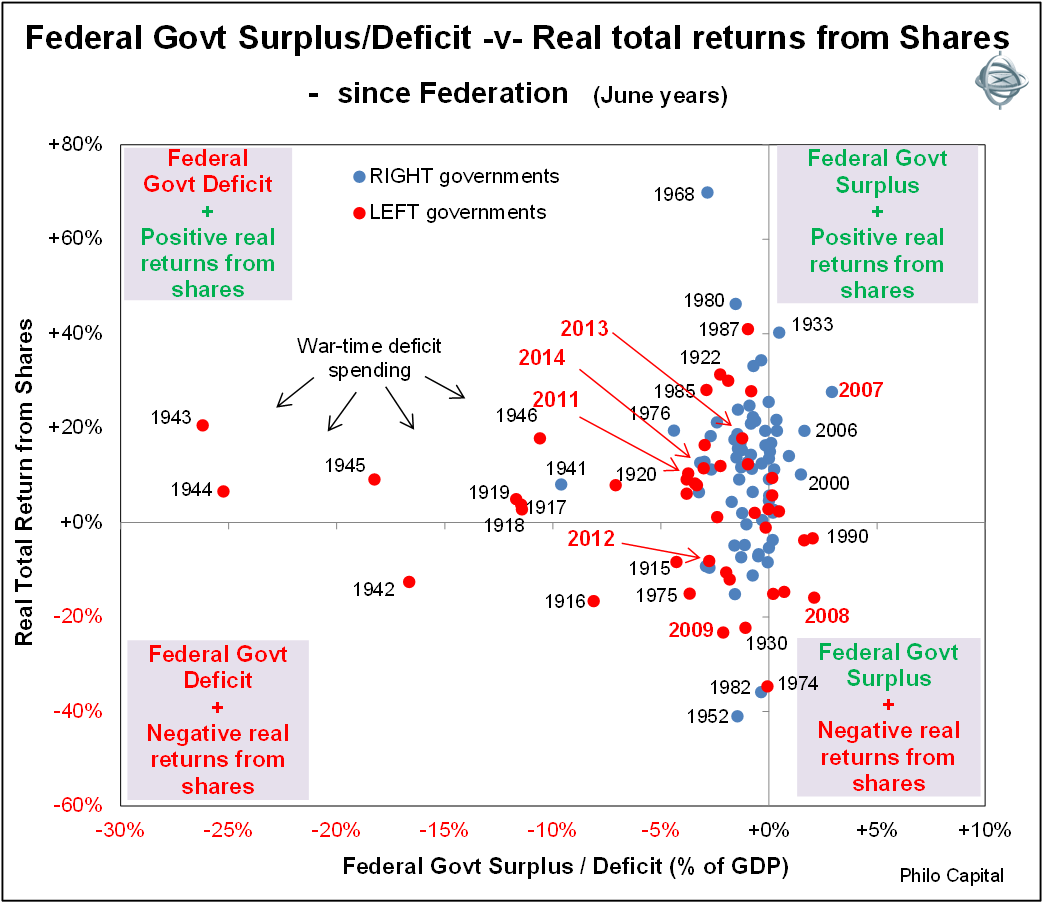
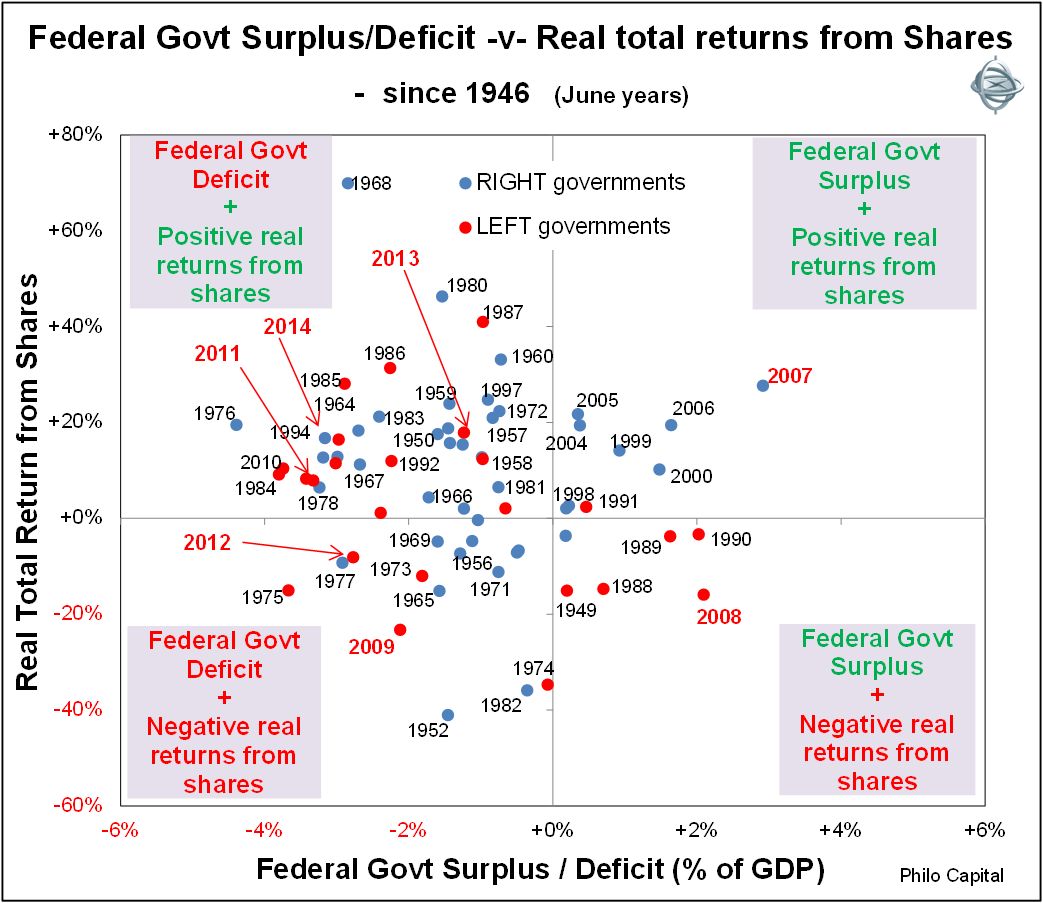
Clearly the war-time years at the left of the chart dominate the overall picture, with very large deficits but also good stock market returns in most years (although returns during World War 2 were somewhat affected by war-time limits on share price movements). World War 2 was particularly good for business in Australia, despite the government’s measures to control prices and limit profiteering. Chart 2 shows the same story but for post-war years only.

Chart 2: Federal government surplus/deficit -v- real total returns from shares post 1946

Deficits are good for stock markets

There has been a mildly negative correlation or inverse relationship between government balances and stock market returns. Most of the high return years from shares were government deficit years (top left section). This includes 2011 and 2013 and the likely result in 2014 (remember all years are June years in this paper).

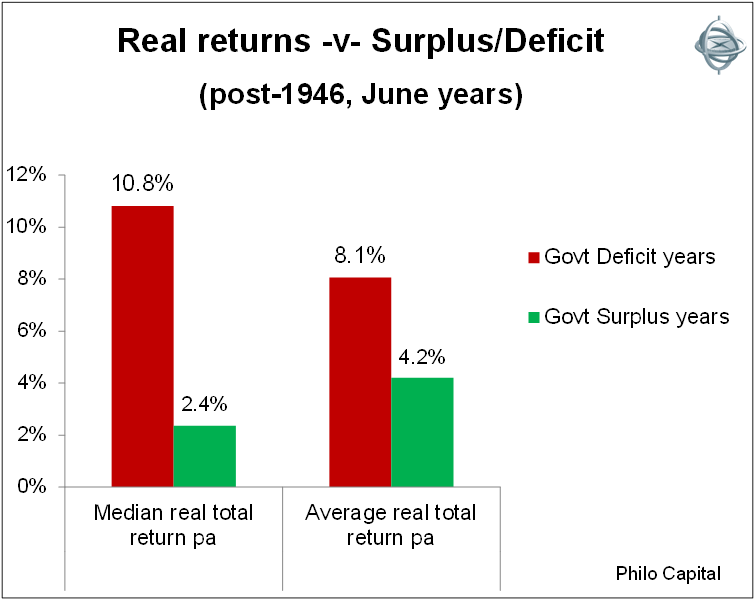
Deficits are generally good for shareholders and surpluses are generally bad for shareholders. In the post-war era the median real total return from shares was 10.8% pa in the deficit years but only 2.4% pa in the surplus years, which is a very significant difference. This is shown in Chart 3.

Chart 3: Real returns from shares -v- Government surplus/deficit - post-1946

There are two main reasons for this. The first is that deficits come about by governments spending more money (and/or taxing less), and much of the additional cash ends up in company coffers, either directly via contracting to the government, or indirectly via household spending.

The second reason is one of timing. Deficits tend to be high in mid-late recessions (when tax revenues are down and welfare spending is up), and this is when shares generally do best, rebounding out of the middle of recessions. This was the case in 1954, 1972, 1983, 1992 and 2010 (and in the pre-war years: 1922, 1923 and 1932).

Tax revenues and welfare payments tend to lag economic activity, both on the way into recessions and in the recoveries on the way out. On the other hand, stock markets tend to lead economic activity. As a result of these leads and lags, stock markets tend to do well in government deficit years, and tend to do poorly in government surplus years.

There have been very few years when government surpluses accompanied negative returns from shares (bottom right section). The most obvious instance was 2008, when tax revenues from the boom were still rolling in but shares were already falling in the GFC.

Some conclusions

History provides useful lessons, and some conclusions are:

  • Government deficit years have generally been good years for stock market returns. 2013-2014 will be a big deficit year and shares are heading for another good year to June 2014.
  • Government surpluses have generally been bad for shareholders, with significantly lower returns from shares compared to returns in deficit years.
  • The differences in returns between surplus and deficit years have been large and significant, regardless of which side of politics was in power at the time.


Ashley Owen is Joint CEO of Philo Capital Advisers and a director and adviser to the Third Link Growth Fund.


Leave a Comment:

RELATED ARTICLES

Budget time and Labor v Liberal on fiscal discipline

Federal Budget 2022: A “magic election pudding”

Living within one’s means

banner

Most viewed in recent weeks

Raising the GST to 15%

Treasurer Jim Chalmers aims to tackle tax reform but faces challenges. Previous reviews struggled due to political sensitivities, highlighting the need for comprehensive and politically feasible change.

7 examples of how the new super tax will be calculated

You've no doubt heard about Division 296. These case studies show what people at various levels above the $3 million threshold might need to pay the ATO, with examples ranging from under $500 to more than $35,000.

Are franking credits hurting Australia’s economy?

Business investment and per capita GDP have languished over the past decade and the Labor Government is conducting inquiries to find out why. Franking credits should be part of the debate about our stalling economy.

Here's what should replace the $3 million super tax

With Div. 296 looming, is there a smarter way to tax superannuation? This proposes a fairer, income-linked alternative that respects compounding, ensures predictability, and avoids taxing unrealised capital gains. 

The rubbery numbers behind super tax concessions

In selling the super tax, Labor has repeated Treasury claims of there being $50 billion in super tax concessions annually, mostly flowing to high-income earners. This figure is vastly overstated.

9 winning investment strategies

There are many ways to invest in stocks, but some strategies are more effective than others. Here are nine tried and tested investment approaches - choosing one of these can improve your chances of reaching your financial goals.

Latest Updates

Taxation

100 Aussies: seven charts on who earns, pays, and owns

The Labor government is talking up tax reform to lift Australia’s ailing economic growth. Before any changes are made, it’s important to know who pays tax, who owns assets, and how much people have in their super for retirement.

7 key charts on the state of the Australian property market

The Australian property market stirs fierce debate - often bullish optimism versus crash predictions. But beyond the noise, seven charts reveal what's really driving prices and the outlook for residential real estate.

A simple alternative to the $3 million super tax

Division 296 aims to introduce improved fairness into the superannuation system, yet is overly complex. This scours the world for better ideas and suggests a simpler alternative which can achieve the same goals.

CBA and the index conundrum for super funds

After the hyperbolic rise in CBA shares, super funds are floating the idea of carving out the weightings of ASX bank securities and indexing them within their portfolios. This looks at why that might be a big error.

Strategy

10 policies to drive Australian productivity higher

Here's a comprehensive list of proposed reforms to fix Australia's stagnating economy, including introducing a flat income tax rate, reducing migration, and making childcare tax-deductible.

Interviews

Where to find big winners in Asia

As more money looks for a home outside the US, Asia may soon get some love. Fidelity's Anthony Srom outlines the best places in Asia to invest, including in Chinese consumer names, Indian financials, and Thailand.

Investment strategies

We have trouble understanding the time value of money

We overvalue the present and underestimate the future - it’s a cognitive glitch called hyperbolic discounting. It affects savings, spending, and loans, and it's more common - and costly - than we think. 

Sponsors

Alliances

© 2025 Morningstar, Inc. All rights reserved.

Disclaimer
The data, research and opinions provided here are for information purposes; are not an offer to buy or sell a security; and are not warranted to be correct, complete or accurate. Morningstar, its affiliates, and third-party content providers are not responsible for any investment decisions, damages or losses resulting from, or related to, the data and analyses or their use. To the extent any content is general advice, it has been prepared for clients of Morningstar Australasia Pty Ltd (ABN: 95 090 665 544, AFSL: 240892), without reference to your financial objectives, situation or needs. For more information refer to our Financial Services Guide. You should consider the advice in light of these matters and if applicable, the relevant Product Disclosure Statement before making any decision to invest. Past performance does not necessarily indicate a financial product’s future performance. To obtain advice tailored to your situation, contact a professional financial adviser. Articles are current as at date of publication.
This website contains information and opinions provided by third parties. Inclusion of this information does not necessarily represent Morningstar’s positions, strategies or opinions and should not be considered an endorsement by Morningstar.