Retirement is complex, and in spite of the volumes of research on the topic, there are rarely simple answers to many questions for those moving into retirement.
Detailed planning around goals, risks and financial resources is critical to manage a long retirement, and a lack of sufficient planning makes retirees financially vulnerable to the risks of outliving retirement savings, overreacting to market volatility, holding inappropriate portfolios and being unprepared for unexpected costs.
The one item that can be controlled is often overlooked
There is however one simple concept that is universally true when it comes to choosing an investment product. It is more important than ever when you are in the drawdown phase. That is, all else being equal, a lower cost product will produce more retirement income than a higher cost product.
Think about that for a second. We spend a lot of time as investors looking for ways to increase retirement income, and one of the easiest ways is often overlooked.
To illustrate how important costs can be, we have looked at income from both the age pension and superannuation drawdown, and the amount a retiree can spend in real terms each year for 30 years with 95% certainty, and we compare two cost scenarios. The first assumes that the retiree is invested in a high cost product charging 1.5%, and the second is a lower cost product charging 0.5%.
The differences are striking.
A single retiree with a $400,000 superannuation balance at retirement can spend over $1,600 (a 4.5% increase) more per year, adding up to more than $48,000 over the course of their 30-year retirement, if they use the lower cost investments (all else equal). For a couple with a combined $800,000 superannuation balance, they can spend more than $2,800 (a 5.0% increase) more per year, or over $85,000 total, when using lower cost solutions.
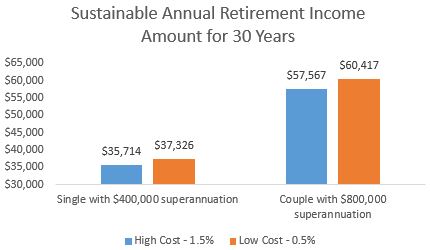
Source: Vanguard, June 2018 Vanguard Capital Markets Model Simulation. See Note 1 below for more details.
The importance of fees increases with wealth
Driven by the higher dependence on superannuation to meet income needs, those retiring with superannuation balances over $1,000,000 will find their sustainable annual retirement income increases 6% to 9% when using lower cost products versus higher cost products.
A key question, always top of mind for those saving for retirement, is ‘How much is enough’? Or how much do they need to save to be comfortable in retirement.
There are many complex planning elements involved in answering that question, but the universal truth on controlling costs still holds.
Assume a couple planning for retirement would like to spend the ASFA Comfortable Retirement Standard ($60,604 in real terms) for 30 years and would like to see the wealth needed to meet that goal with different probabilities of success.
Again, we have incorporated both the age pension and superannuation drawdown, and we look at the superannuation balance needed to meet this income objective with 50%, 75%, and 95% probability while paying low (0.5%), moderate (1.0%), or high (1.5%) costs.
Focusing on the 95% probability, we see that roughly for every 50 bps increase in costs, the couple needs an additional 10% in their superannuation to meet their goal, and comparing the high cost 1.5% scenario to the low cost 0.5%, we can see a difference of $167,000 ($977,000 versus $891,000) in wealth needed to meet the same objective.
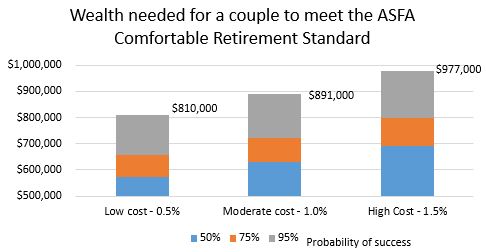
Source: Vanguard, June 2018 Vanguard Capital Markets Model Simulation. See Note 2 below for more details.
All costs cannot be avoided
Investors will almost certainly need to pay some investment costs for a quality product, with some choosing to pay higher fees for the prospect of outperformance, and there is more to investing than costs alone, such as the value of quality financial advice.
But in the end, cost is one of the few things you can control and keeping an eye on costs is a great way to boost your retirement income prospects.
Notes on charts
Note 1: The income levels shown are based on a constant real spending amount over a 30-year horizon with a 95% probability of success. Retirees are homeowners with a balanced (50% equity/50% bond) portfolio. The model incorporates the age pension as at 20 September 2018 and only considers financial wealth and therefore does not consider assets that would not be deemed to earn an income (i.e. home contents) or additional income (i.e. employment income) which would shift eligibility. The model treats superannuation and non-superannuation assets as one pool of financial assets and therefore we have assumed that any minimum withdrawals from super that exceed the retirement income targeted are reinvested in a non-super account. All values are in real terms. The examples used here are general only and do not consider any personal information. Actual age pension received may differ from that represented by the analysis due to a range of legislative and personal factors. The projections or other information generated by the Vanguard Capital Markets Model (VCMM) regarding the likelihood of various investment outcomes are hypothetical in nature, do not reflect actual investment results, and are not guarantees of future results. Distribution of return outcomes from the VCMM are derived from 10,000 simulations for each modeled asset class in AUD. Results from the model may vary with each use and over time.
Note 2: The ASFA Comfortable Retirement Standard as at June 2018 is $42,953 per year for a single and $60,604 per year for a couple. We have assumed 0.5%, 1.0%, and 1.5% annual investment fees, the retirees are homeowners and a balanced (50% equity/50% bond) portfolio. The model incorporates the age pension as at 20 September 2018 and only considers financial wealth and therefore does not consider assets that would not be deemed to earn an income (i.e. home contents) or additional income (i.e. employment income) which would shift eligibility. The model treats superannuation and non-superannuation assets as one pool of financial assets and therefore we have assumed that any minimum withdrawals from super that exceed what is needed to meet the ASFA retirement standard are reinvested in a non-super account. A non-homeowner would need to consider rental costs in addition to the Retirement Standards. All values are in real terms. The examples used here are general only and do not consider any personal information. Actual age pension received may differ from that represented by the charts due to a range of legislative and personal factors. The projections or other information generated by the VCMM regarding the likelihood of various investment outcomes are hypothetical in nature, do not reflect actual investment results, and are not guarantees of future results. Distribution of return outcomes from the Vanguard Capital Markets Model (VCMM) are derived from 10,000 simulations for each modeled asset class in AUD. Results from the model may vary with each use and over time.
Aidan Geysen is Head of Investment Strategy at Vanguard Australia, a sponsor of Cuffelinks. This article is for general information purposes only and does not consider the circumstances of any individual.
For more articles and papers from Vanguard Investments Australia, please click here.