Register For Our Mailing List

Register to receive our free weekly newsletter including editorials.

Home / 38

Index versus active? Nobel Prize professors can’t agree

The ‘index versus active’ investing debate is one of the oldest arguments in the industry. On one side, researchers point to the legends of the market (think Buffett, Templeton, Lynch, Gross) who have outperformed a market index over long time periods. On the other side, as many brilliant minds point to statistics which show the majority of active managers underperform the index after fees over long time periods, and of course there will be some above average in a sample of thousands - that’s how probabilities work in any game of chance.

The professors can't agree, what hope for mere mortals?

The debate had another run this week when the Nobel Prize for Economics was shared by world-renowned professors with opposite views. In one corner is Professor Eugene Fama, who gave us the modern efficient markets theory that share prices incorporate all available information and there are no mispricings to exploit to consistently deliver outperformance. Fama’s conclusion in his paper (with Kenneth French), Luck versus skill in mutual fund performance, was:

“Going forward, we expect that a portfolio of low cost index funds will perform about as well as a portfolio of the top three percentiles of past active winners, and better than the rest of the active fund universe.”

The other Nobel winner, Professor Robert Shiller, says of efficient markets, “the theory makes little sense, except in fairly trivial ways”, and he draws on behavioural science to show the human errors involved in market pricing. He emphasises the extent to which individual investors misperceive and overreact to information.

Outperformance comes in many guises. Rosalind Hewsenian, CIO of a major US charitable trust and an investment consultant from 1985 to 2006, in this excellent article called ‘Beating the market has become nearly impossible’ (Institutional Investor, 18 September 2013), says:

“Most of my career was dominated by the twin rallies of the stock and bond markets. Alpha was generated by simply tilting risk a little higher than the markets generally and you could outperform.” (Note: alpha is a measure of excess returns).

Most asset manages do not accept such a humble and self-deprecating explanation.

About 80% of securities listed on the ASX are owned by institutional funds, domestic and foreign, each managed by highly qualified and skilled experts. There are thousands of stock pickers and analysts, all educated at the best universities in the world and most with decades of experience. They are the market and they own the index, and some will underperform and some will outperform. A few will look really good, and they will win awards and attract money. But how do we separate skill from chance? For example, the probability of making 60 correct guesses out of 100 coin tosses is about 2.8%. So if we have, say, 100 participants who guess a coin toss every month for 10 years, about three of them will correctly guess 60 out of 100. Are these the celebrated fund managers who have outperformed all the others? Surely, a decade of excellence in coin-tossing proves their added skill. But then what happens next year, on the next set of tosses?

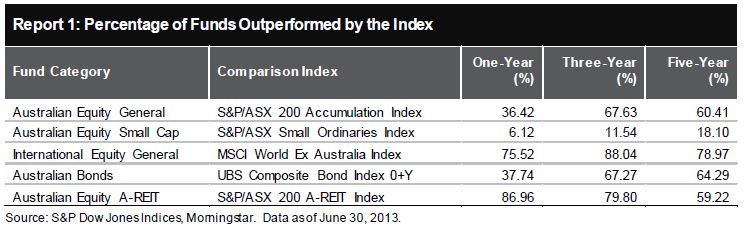
The latest ‘Index Versus Active’ scorecard

So it is opportune that in the same week as the Nobel Prize announcement, the updated SPIVA scorecard was released. This is a tortured abbreviation for the Standard & Poors’ (SP) Index Versus Active (IVA) scorecard. The report is issued semi-annually, the latest for mid-year 2013, and it tracks the performance of actively-managed Australian funds versus their benchmarks, corrected for survivorship bias.

The comparisons of active versus index over only 12 months are not much value. For example, in the year to 30 June 2013, 60% of active Australian equity funds outperformed the S&P/ASX200 Accumulation Index, but in the previous year, 70% underperformed over one year. Longer time periods must be studied.

The results over five years, summarised in the table below, are:

  • the index outperformed over 60% of active Australian equity funds, and over three years, 68% of managers lagged their benchmarks
  • 82% of small cap Australian equity managers actually outperformed their index. This occurs over all periods studied in the report. There are two reasons usually given why small cap managers consistently outperform their index. First, the index includes many speculative small resources companies with a dream but no decent cash flows, which eventually collapse, and managers often avoid these disasters. Second, small caps are less analysed than ASX100 companies, and it is possible to identify undervalued gems with excellent prospects
  • 79% of active international equities underperformed their index, and 88% over three years
  • 64% of active Australian bond funds failed to beat their index
  • 60% of active Australian A-REIT funds failed to beat their index (and 87% in the last year)
  • Only 81% of the asset managers from five years ago still exist.

It’s not much of a scorecard for the millions of hours of number-crunching and company visits by talented active managers. Or are they all so talented that they cannot beat each other?

Ironically, S&P believes active management provides a useful role, since the massive amount of research undertaken keeps prices close to fair values and allows index investors to take a free ride without paying the costs. They call this a ‘fragile equilibrium’, and quoting William F Sharpe:

“Should you index at least some of your portfolio? This is up to you. I only suggest that you consider the option. In the long run, this boring approach can give you more time for more interesting activities such as music, art, literature, sports and so on. And it very well may leave you with more money as well.”

It’s your call, depending on who and what you know. If you think you can identify the few managers who outperform the index consistently over time, either by research or based on advice, go for it. At least you’ll have more fun watching him (it’s always a man) explain the variability to the index and why his style did not work last year. If you don’t have an opinion, or don’t have the time, stick to an index. If there’s one thing you can control, it’s the cost, and the range of index funds now available allows wide choice to implement most asset allocation strategies.


12 Comments
Warren Bird
January 28, 2014

Your list of events and dates doesn't give us enough information to answer the question, because you say nothing about the decision making processes that have gone into the construction of each index.

I think they all were. They all have rules to determine what stocks are included, and those rules are, effectively, an investment strategy. And they all claim to be reasonably replicable - why would that matter if investing in the universe of index stocks wasn't intended?

But even if they weren't originally intended as an investment strategy, does that have to mean that they aren't suited to the task? They may not be the optimal strategy - that's the whole passive vs active debate - but they are a valid strategy.

Dropout
January 27, 2014

Let's take a step back and ask a very simple and fundamental question, where did the index come from?

Here's a summary:

1882 Charles Dow, Eddie Jones and Charles Bergstrasser form Dow, Jones and Co.

1884 The first Dow Jones Average appears in the Afternoon News Letter on July 3rd. It consisted of the closing prices of nine railroad and 2 industrial stocks.

1885 The Afternoon News Letter becomes the Wall Street Journal.

1896 The companies listed on New York Stock Exchange are: 12 industrials, 53 railroads and 6 utilities. Banks and insurance companies are traded over-the-counter.

1896 The first strictly industrial Dow Jones Average of industrial stocks is published with the following stocks: General Electric, American Cotton Oil, American Sugar, American Tobacco, Chicago Gas, Distilling and Cattle Feeding, Laclede Gas, National Lead, North American, Tennessee Coal and Iron, US Leather preferred and US Rubber.

1932 Alfred Cowles establishes the Cowles Commission for Research in Economics.

1933 The Cowles Commission publishes a paper in Econometrica entitled “Can Stock Market Forecasters Forecast?” A three-word abstract of this paper runs as follows: “It is doubtful”.

1938 Common-Stock Indexes, by Cowles and Associates, appears presenting the results of the extensive gathering and compiling of data on the stock market, and contains indexes of prices with adjustments for rights, splits, dividends, etc., and of yield expectations, yields, dividends, earnings-price ratios, and earnings for a large group of common stocks comprising ninety to a hundred per cent of the value of all those listed on the New York Stock Exchange, 1871–1939 and for sixty-eight subgroups of these stocks.

It took over 1,500,000 worksheet entries and over 25,000 hours on a primitive Hollerith punch-card computer to calculate the index.

Price-weighted indices remained more popular than market capitalization weighted indices simply because of the time and money it took to calculate the latter as opposed to the simplicity of the former.

The work done by the Cowles would go onto become the S&P 500 index.

1941 Standard Statistics merges with Poors Publishing to form Standard and Poors.

1957 Standard and Poors launches the S&P 500. Up until the introduction of cheaper computing power in the early 1960s, the index is only calculated monthly in-arrears.

1971 The first index fund is launched by Wells Fargo with a $6 million investment from the Samsonite pension fund. The fund holds an equal amount in each of the 1500 stocks listed on the NYSE. The need for frequent rebalancing and heavy transaction costs lead to poor performance.

1973 The Wells Fargo and Illinois Bell pension funds each contribute $5 million to the first market capitalization-based index fund. The fund, run by Wells Fargo, used a sampling approach as the seed funding was less than $25m, the amount needed to buy 1000 shares of each of the companies in the S&P 500. When the fund hit $25m in $AuM, it invested in all 500 stocks.

1976 Jack Bogle and Vanguard launch first S&P 500 index mutual fund with $11m in $Aum. The fund is the first index investment strategy aimed at retail investors.

1993 Standard & Poor's Depositary Receipts (SPDRs) were launched by Boston asset manager State Street Global Advisors as the first exchange-traded fund (ETF) in the United States (preceded by the short-lived Index Participation Shares that launched in 1989).


Now after reading this summary answer this question - was a market cap index ever designed to be an investment strategy?

Investor
November 24, 2013

There are arguments both ways for active and passive investing, but the research is fairly conclusive. It is hard to beat the investment returns achievable from a low fee passive investing approach over the long term (either before or after tax). In my view time is probably the biggest issue, as Keynes once said in the long term we are all dead!

I'm doubtful it is possible to time the markets, but even index investors need to keep one eye on value. Buying any investment for more than it is worth will make it difficult for an investor to make a decent return from it.

Warren Bird
November 07, 2013

It's a bit harsh to say that 'no fundie' wants to talk about after-tax returns. There are a growing number of tax aware funds and strategies out there these days.

Sonia Main
November 07, 2013

The other elephant in the room is tax drag of active management. Investors are ultimately only interested in after-tax returns – but no fundie in Australia wants to talk about that. After-tax returns are often lower for active managers due to often much higher turnover.

Brent
November 05, 2013

What I find interesting about SPIVA is that the data is just too high level. By definition, if you want a return different from the market, you must hold a portfolio different from the market. We know this, but this survey and others like it don't actually tell you a whole lot about active performance?

Are there any statistically significant commonalities between the under-performing funds and the outperforming funds over long time periods? Do those funds with high active share or tracking errors produce the larger share of alpha? How about specific styles, do those with long/short capabilities or benchmark unaware mandates have a statistically significant edge?

Fund marketing happily suggests so, but for me, this is what such a survey should be tracking. Not only that, but what about some form of risk adjustment? That's a hugh issue for surveys like this.

If a manager under performs the asx by 1% but had only 60% of the index volatility, has he actually underperformed? Quite possibly he has provided a better money weighted outcome than the manager with 3% absolute alpha? Especially if the outperforming manager experienced much higher vol to achieve it, exactly the CIO's quote from the article, you didn't actually outperform anything, you just upped your risk and achieve exactly what the index could have with the same vol leverage.

But once again, a simple binary survey such as this does nothing to explore this, I'd go as far as saying it provides both false negatives and positives in the context or real world capital management. This is all quite disappointing given they have no doubt captured all the data required to cover these points. It just requires are re think on what exactly the survey was designed to communicate.

Martin Conrad
November 05, 2013

Too much academic and marketing emphasis is placed on investment or fund (time-weighted) gains instead of the gains investors in those investments or funds actually get and keep--investor or dollar-weighted gains. The MAIN risk for the vast majority of individual investors is NOT that they will buy into an investment or a fund that underperforms overall market results. By FAR the largest real losses result from investors underperforming the investments or funds they do invest in, because they buy and sell them at the wrong times, trying to time the market and getting it mostly backwards. A few years ago I discussed this problem in my featured guest editorial commentary "The Money Paradox" in BARRON'S. Almost any fund or investment that controls or mitigates this problem (with better communications and less volatility, for instance) will likely give the biggest improvement in actual results for typical investors.

Jamie Forster
November 02, 2013

The current academic approach to researching investment manager performance is becoming increasingly less relevant.

A comparison of active management of a unitised structure vs passive management of a unitised structure fails to consider the advantages that a fund manager managing a portfolio of direct assets has over a unitised structure.

Constraints on active managers of unitised structures mean that they more closely resemble index portfolios than they do high conviction portfolios.

Fund managers managing direct portfolios have considerable and meaningful advantages over fund managers managing unitised structures.

Of these advantages, the most meaningful and most measurable is the ability to manage for the investor's specific tax circumstances. All else being equal, a direct portfolio must outperform a unitised structure with the small number of studies done so far suggesting a minimum of 1% outperformance based on tax management alone. As these studies were not Australian based, and given the tax-structure of the Australian equities market, this suggests that the after-tax outperformance for an AEQ portfolio may be even greater. Indeed, just one good-sized share buy-back will add enormous value to a portfolio depending on the investor's tax bracket.

Paul Umbrazunas
November 01, 2013

The key here is Graham's words "over long time periods" and, with the caveat, subject to sequencing risk. Purported alpha, whilst always debatable in the first instance, needs to be put in the context of both longer term "form" and halo effects such that for every Warren Buffet there is (your number X, for which X>>Buffet by a large amount) of underperforming funds (net of fees) or those that have closed. Good luck being able to regularly and, over the longer term pick the "winners".

I think we need to turn the concept around in terms of maximising long term wealth outcomes from picking winners to avoiding/mitigating disasters and managing downside. A 20% loss of value from par requires a 25% return to break even (ignoring the time to retrace this drawdown) - pick your lognormal alternative but it's still harder to regain the losses! This approach however flies in the face of "the smartest alpha guys in the room" pitch and we couldn't have that could we...or should we...

Graham Hand
October 31, 2013

Hi Aaron, if you think S&P's analysis is misleading, then perhaps you should have a word with them. It should be easy for them to do as you suggest, which is deduct a fee estimate from the performance of the index. I doubt it would materially change the result, since it's possible to buy an index global ETF for around 10 basis points or 15 basis points for Aussie. It would help if S&P did as you suggest and give an indication of the extent of underperformance. And in case you think I'm on one side of this debate, I personally have money with several active managers who I do expect to outperform the market. But I'm saying if someone doesn't have a view, then choosing an index is an appropriate decision.

george
October 31, 2013

it would be interesting to analyse performance of index timing (active index investing) Vs passive index investing to complete the picture

Aaron
October 31, 2013

Graham
While I see both sides of the index v active argument I find the use of this SPIVA indicator as misleading.
You cannot invest passively and get the exact index return (Macquarie's True index funds are not easily available to retail investors directly)
If you were to run the same metric for the passive funds, namely net performance of the fund after all fees and charges, you will discover that ~100% of passive funds underperform the index.
The comparison for Australian equity funds becomes 40% (active) v 0% (passive). While this doesn't give any indication of the extent of any net underperformance, only using one side of the measure is meaningless.


Leave a Comment:

RELATED ARTICLES

Index versus active – our readers reprise

Know who’s managing your business

Watch the performance of performance fees

banner

Most viewed in recent weeks

2024/25 super thresholds – key changes and implications

The ATO has released all the superannuation rates and thresholds that will apply from 1 July 2024. Here's what’s changing and what’s not, and some key considerations and opportunities in the lead up to 30 June and beyond.

The greatest investor you’ve never heard of

Jim Simons has achieved breathtaking returns of 62% p.a. over 33 years, a track record like no other, yet he remains little known to the public. Here’s how he’s done it, and the lessons that can be applied to our own investing.

Five months on from cancer diagnosis

Life has radically shifted with my brain cancer, and I don’t know if it will ever be the same again. After decades of writing and a dozen years with Firstlinks, I still want to contribute, but exactly how and when I do that is unclear.

Is Australia ready for its population growth over the next decade?

Australia will have 3.7 million more people in a decade's time, though the growth won't be evenly distributed. Over 85s will see the fastest growth, while the number of younger people will barely rise. 

Welcome to Firstlinks Edition 552 with weekend update

Being rich is having a high-paying job and accumulating fancy houses and cars, while being wealthy is owning assets that provide passive income, as well as freedom and flexibility. Knowing the difference can reframe your life.

  • 21 March 2024

Why LICs may be close to bottoming

Investor disgust, consolidation, de-listings, price discounts, activist investors entering - it’s what typically happens at business cycle troughs, and it’s happening to LICs now. That may present a potential opportunity.

Latest Updates

Shares

20 US stocks to buy and hold forever

Recently, I compiled a list of ASX stocks that you could buy and hold forever. Here’s a follow-up list of US stocks that you could own indefinitely, including well-known names like Microsoft, as well as lesser-known gems.

The public servants demanding $3m super tax exemption

The $3 million super tax will capture retired, and soon to retire, public servants and politicians who are members of defined benefit superannuation schemes. Lobbying efforts for exemptions to the tax are intensifying.

Property

Baby Boomer housing needs

Baby boomers will account for a third of population growth between 2024 and 2029, making this generation the biggest age-related growth sector over this period. They will shape the housing market with their unique preferences.

SMSF strategies

Meg on SMSFs: When the first member of a couple dies

The surviving spouse has a lot to think about when a member of an SMSF dies. While it pays to understand the options quickly, often they’re best served by moving a little more slowly before making final decisions.

Shares

Small caps are compelling but not for the reasons you might think...

Your author prematurely advocated investing in small caps almost 12 months ago. Since then, the investment landscape has changed, and there are even more reasons to believe small caps are likely to outperform going forward.

Taxation

The mixed fortunes of tax reform in Australia, part 2

Since Federation, reforms to our tax system have proven difficult. Yet they're too important to leave in the too-hard basket, and here's a look at the key ingredients that make a tax reform exercise work, or not.

Investment strategies

8 ways that AI will impact how we invest

AI is affecting ever expanding fields of human activity, and the way we invest is no exception. Here's how investors, advisors and investment managers can better prepare to manage the opportunities and risks that come with AI.

Sponsors

Alliances

© 2024 Morningstar, Inc. All rights reserved.

Disclaimer
The data, research and opinions provided here are for information purposes; are not an offer to buy or sell a security; and are not warranted to be correct, complete or accurate. Morningstar, its affiliates, and third-party content providers are not responsible for any investment decisions, damages or losses resulting from, or related to, the data and analyses or their use. To the extent any content is general advice, it has been prepared for clients of Morningstar Australasia Pty Ltd (ABN: 95 090 665 544, AFSL: 240892), without reference to your financial objectives, situation or needs. For more information refer to our Financial Services Guide. You should consider the advice in light of these matters and if applicable, the relevant Product Disclosure Statement before making any decision to invest. Past performance does not necessarily indicate a financial product’s future performance. To obtain advice tailored to your situation, contact a professional financial adviser. Articles are current as at date of publication.
This website contains information and opinions provided by third parties. Inclusion of this information does not necessarily represent Morningstar’s positions, strategies or opinions and should not be considered an endorsement by Morningstar.