Looking for an emerging market to invest in? How about this one:
- real GDP growing at rates of more than 7% a year for five decades, including three decades of growth above 10% a year. This is better than any other emerging market. China has had only three decades above 7% growth (in the 1980s, 1990s and 2000s); India and Brazil have had only one decade above 7% (India in the 2000s, Brazil in the 1970s)
- a stock market that has delivered market index returns of more than 40% a year in eight different years, including one year of 66% returns
- a very young population with a median age of just 22
- no welfare system, no labour laws, and virtually no domestic taxes or regulations.
Where is this marvellous place to invest? Before answering, be aware that this country has also suffered many of the negatives often associated with emerging markets, including:
- bouts of run-away inflation above 20%, and deflation worse than minus 15% at times
- government debts, which at one time soared to more than 200% of GDP (worse than Japan now and more than double the levels in Greece and Portugal)
- current account deficits that ran at times at more than 30% of GDP (twice as bad as Portugal, Italy, Ireland, Greece and Spain – the PIIGS – today)
- default on its government debt, and a $40 billion (in today’s dollars) restructuring of government debt (or debt equivalent of 100% of its GDP), where investors took a ‘hair-cut’ and lost more than 20% of their interest payments and had to wait up to 30 years to get back the principal on their loans
- suffered a (brief) military coup
- the ousting of democratically elected leaders by foreign rulers – twice
- as an ex-colony of a European military power, wiped out most of the native population in bloody battles, confiscated land and spread diseases.
Where was this vibrant investment opportunity?
In short: a young, vibrant ‘frontier-land’ economy with few rules, plenty of adventure, abundant untapped resources, and ample opportunities to make fortunes quickly for canny investors.
Where was this great emerging market? Well, you’re sitting in it!
Australia was the stand-out ‘emerging market’ of the 19th century. Its rapid growth spurt started with the success of wool exports to Britain in the 1820s and 1830s, then the gold rush from the early 1850s followed by minerals and property booms in the 1870s and 1880s. (New Zealand also enjoyed real GDP growth rates of more than 10% in the 1840s, 1850s and 1860s).
The following charts show five centuries of economic growth rates in various countries. The first chart shows the first great wave of industrialisation, which started in Britain and spread to the rest of Western Europe. The first wave of emerging markets were the British ex-colonies where the colonists overpowered the native inhabitants and cleared the land to produce agricultural exports for the markets back home - firstly the US, then Canada, Australia and New Zealand.
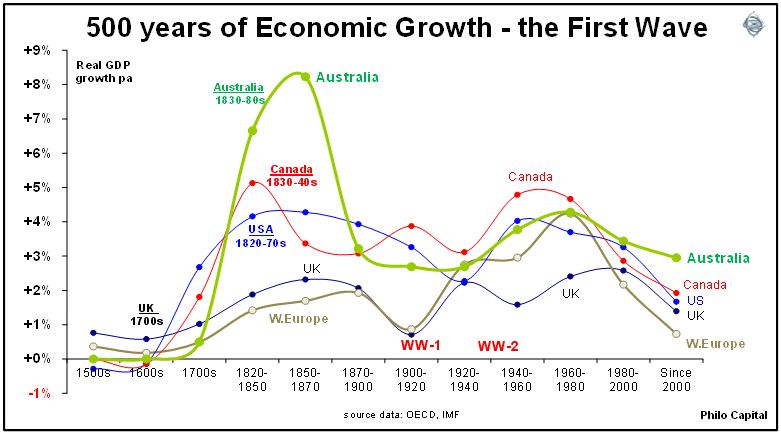
After World War II, Germany was the main emerging market in Europe and the reconstruction effort spread across western and northern Europe in one huge development area – financed largely by the US as a buffer against the Soviet threat in the Cold War. Canada, the US and even Britain also experienced relatively rapid growth in the post-war baby boom years.
Does the end of the period of explosive growth mean the end of great investment returns? As emerging markets mature, economic growth slows as the population ages, productivity gains give way to redistribution, and these trends are accompanied by increases in the size of government and rising levels of regulation, welfare, and taxes to pay for it all.
All emerging markets end their dream run, but this does not necessarily mean disaster for investors. In the case of Australia, economic growth slowed to a more stable 3%-4% during the 20th century, but the Australian stock market as a whole still delivered returns of an incredible 11% a year (or 7% after inflation) in the 20th century while economic growth slowed down.
The second chart shows the growth paths of the next wave of emerging markets, and shows Australia’s for comparison.
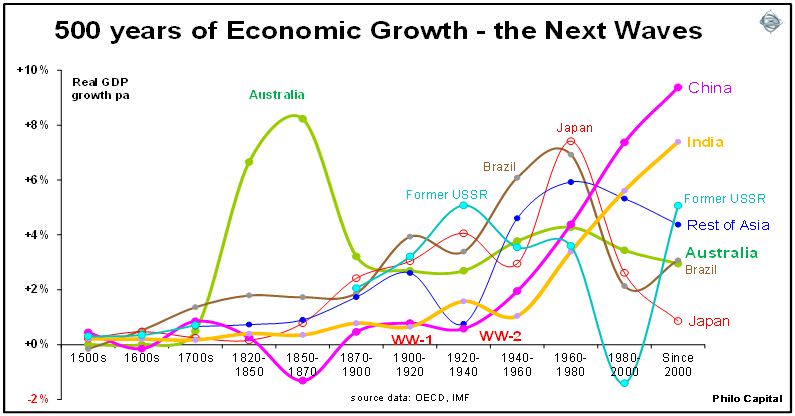
Although recent growth in China and India looks rapid, this growth has been along similar lines to that of Australia and New Zealand in the 19th century. Rapid growth does not and will not last forever, as economies mature and living standards rise more slowly as they catch up.
The next chart shows the rises in living standards in various countries over the past two centuries. The lines represent GDP per capita in real dollars. The steepness of the upward sloping lines indicates the rate of growth.
We can see that the slope of the line for China in recent years has been no steeper than say Japan in the 1950s to the 1980s, or those of Hong Kong, Singapore, Taiwan or Korea in the 1970s-1980s or indeed Australia’s curve in the first half of the 1900s.
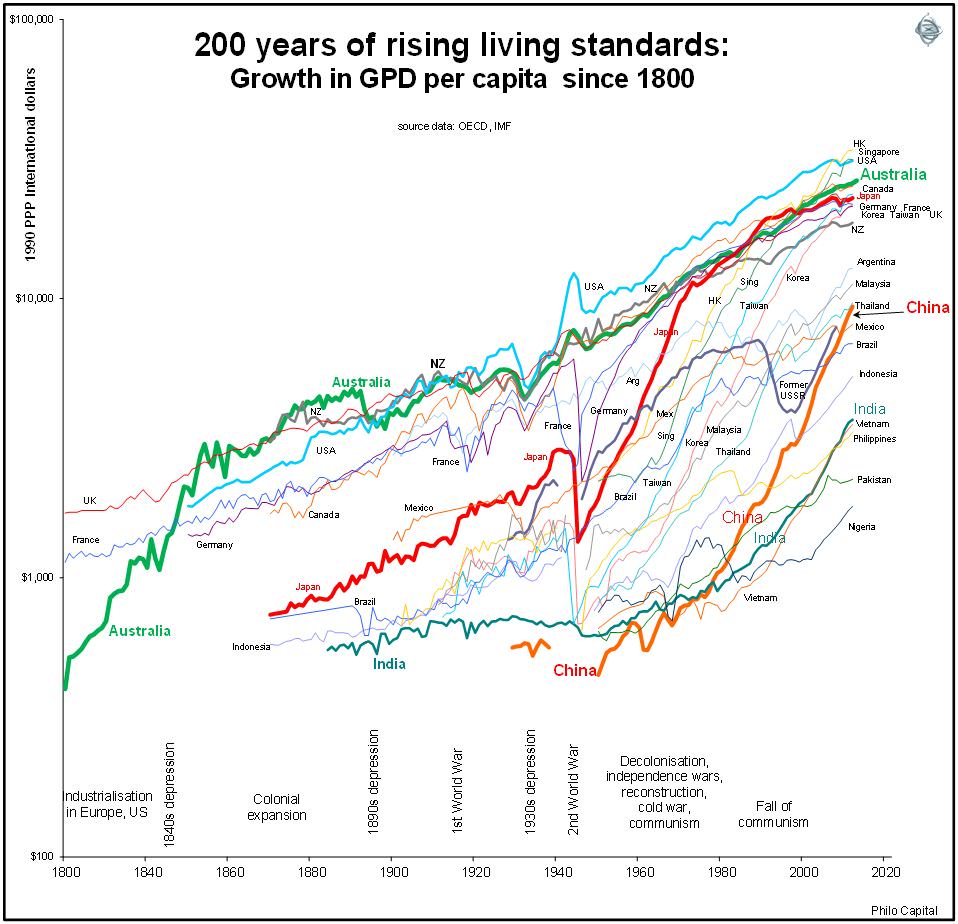
After Australia’s explosive growth in the first half of the 1800s, Australians enjoyed the highest living standards in the world for much of the second half of the 19th century (with New Zealand not far behind). Growth rates in the subsequent half century were not as rapid, but we were already on top of the table.
Australia was hit especially hard by the 1890s global depression, made worse by a severe drought here, then World War I, the 1930s depression and World War II. In the second half of the 20th century, our growth was supported by high levels of immigration, and a wave of free market reforms in the 1980s and 1990s that attracted high levels of investment.
The US has had the straightest path of all since the mid 19th century – aside from a dramatic drop in the 1930s depression and an equally dramatic spike in the World War II boom.
We can also see the collapse of the German and Japanese economies following World War II and their rapid re-emergence as the great emerging markets of the post-war reconstruction period.
The Asian tigers followed soon after – Hong Kong, Singapore, Taiwan and Korea had steep upward growth paths in 1960s and 1970s – following the Japanese lead. Living standards in Hong Kong and Singapore have now caught up with the old world countries, and they are now classified as developed markets.
The next breed of emerging markets appears as steep upward sloping paths on the right side of the chart. The growth paths of China, India, Vietnam, Indonesia, and the Philippines are as steep as those of Japan and Germany in the post-war era, but no steeper than Australia’s path in the 19th century. The rises of Brazil and Mexico have not been as rapid, but they have taken place over longer periods.
The chart also highlights the fact that the 2008 financial crisis was a relatively minor hiccup in economic growth compared to the deep contractions in the 1930s. The 2008 crisis seemed a big deal because it is fresh in our memories, and because it has been so long since the last contraction, but it is hardly visible in the broad sweep of economic history.
Ashley Owen is Joint Chief Executive Officer of Philo Capital Advisers and a director and adviser to Third Link Growth Fund.