In Part 2 of our ‘January effect’ examination, we respond to several readers who asked whether the poor January 2016 in the share market foretells a bad result for the whole year, or is the market more likely to rebound because it has been over-sold?
Put another way, based on what happens in January, is there either:
- a ‘momentum’ effect, where January returns tend to be continued for the rest of the year, or
- a ‘reversion’ effect, where January returns tend to be the opposite for the rest of year?
History favours a small momentum effect
Historically, positive returns in January have turned into positive full year returns most of the time (80% of years in the US and 72% in Australia). Conversely, low returns in January have turned into low full year returns most of the time. Since 1900, the statistical correlation between January returns and full year returns have been 0.40 in the US market and 0.46 in the Australian market. These moderate positive correlations may indicate the presence of a momentum effect in both markets.
But there is a little sleight of hand going on here. Since the January returns are included in the full year returns, the correlations are artificially high because they double-count January. High return years end up being high partly because of the good start in January (in Part 1, we observed that, on average, January has been the best month in both the US and Australian markets for more than a century).
The problem is that after January’s result is known at the end of January, unless you are Marty McFly or Doctor Who, you can’t go back in time to sell or under-weight shares at the start of the year if January was bad, or over-weight if January was good, in order to get the full year return. All that is important now is the future - the likely return for the rest of the year from the start of February to the end of December.
Since 1900, the correlation between January returns and the ‘rest of year’ returns have been 0.19 in the US market and 0.23 in Australia. These are much lower than the full year results but they indicate a possible weak momentum effect.
If such a momentum effect did persist, we could make excess returns by over-weighting shares for the rest of the year after a good January and under-weighting after a bad January. This sounds like another market anomaly or inefficiency (another ‘free lunch’!).
As statistical correlation numbers are often misleading, ambiguous and say nothing about underlying causes let’s look at the actual results.
Rest of year returns after January – US market
The first pair of charts show that the ‘rest of year’ returns in the US have been higher in years when January was up, compared to years when January was down.
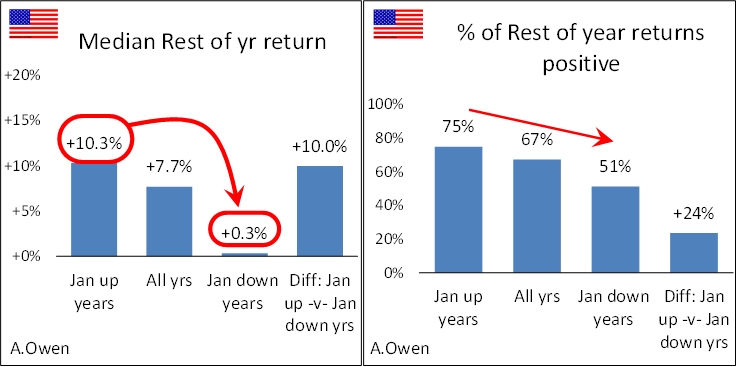
The 10% median rest of year return in years when January was up is significantly higher than the 0.3% median rest of year return in years when January was down.
Also the right chart above shows that in years when January was up, the rest of the year was up 75% of the time, but in years when January was down, the rest of the year was up just 51% of the time. This means the incidence of losses over the rest of the year were more frequent in years that started off with a down January.
The problem with exploiting the January effect
Unfortunately, just like the original ‘January effect’ we analysed in Part 1, what appears to be another ‘free lunch’ also disappears on closer inspection. The above charts look at the period from 1900 to 2015 as a whole, but the next chart takes the 10% median ‘rest of year’ return difference between ‘up January’ years and ‘down January’ years and breaks it into decades.
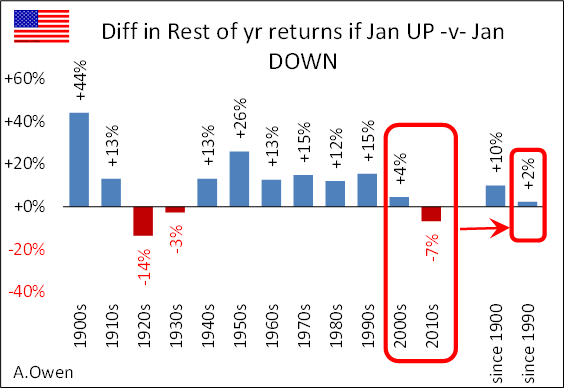
Positive blue bars indicate decades when the rest of year returns following positive Januaries exceeded rest of year returns following negative Januaries (momentum effect). Red negative bars indicate the opposite - a reversion effect - when the rest of year returns in negative January years were higher than rest of year returns in positive January years.
The decade by decade results show that this effect has largely disappeared in the past couple of decades. The bar on the far right shows the difference since 1990 to be much smaller than the 10% difference over the whole period.
Rest of year returns after January – Australian market
The first pair of charts for Australia show that the rest of year returns have been a little higher in years when January was up, compared to years when January was down, but the difference has not been statistically significant (unlike in the US were the difference has been much larger).
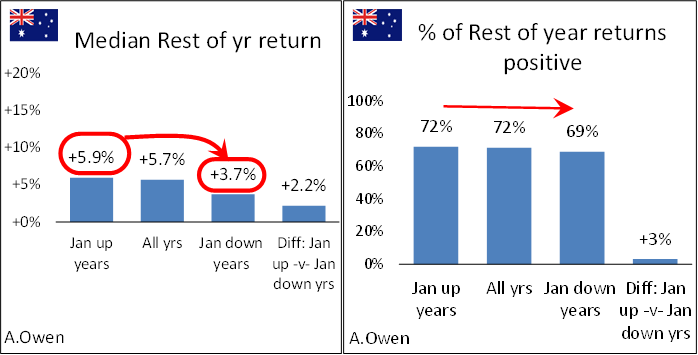
Also the right chart shows that in years when January was up, the rest of the year was up 72% of the time, but in years when January was down, the rest of the year was up 69% of the time. Here too there has been no significant difference in Australia, unlike the US market where the difference has been large.
Reasons for difference between US and Australia
Rather than just look at the numbers, I always try to understand the fundamental drivers at work.
January is a big month in the US: 4th quarter and full calendar year-end profit results, payment of the 4th quarter dividend, and often the announcement of annual dividend increases after the full year results. Much price-changing news for investors to digest and act upon. In contrast, January is quiet in Australia – the long summer break (whereas the US has its long summer break mid-year), no profit reports (most Australian companies have June year-end), December half-year reports are released in February here, not January) and few dividend payments, and rarely if ever any dividend announcements. It is no wonder the results for January compared to the rest of the year have been quite different in Australia and the US markets.
The next chart shows the difference in Australia in rest of year returns between ‘up January’ years and ‘down January’ years broken down into decades.
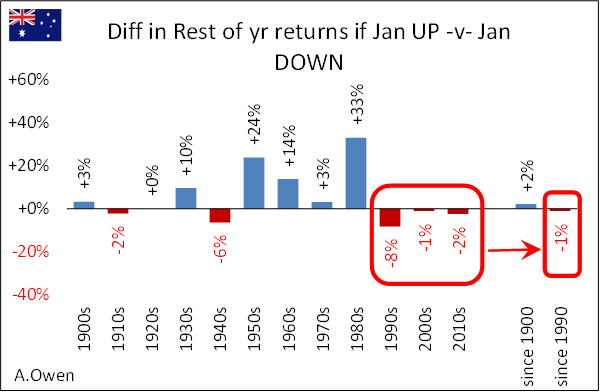
This shows that the effect has been much patchier and inconsistent than in the US, and is mainly the result of two isolated decades – the 1950s and 1980s. I would not base a strategy on such an effect in the past 100+ years.
The bar on the far right shows the difference since 1990 to be insignificant in recent decades, as in the US market.
Conclusion
In the US stock market there was a relatively strong momentum effect for ‘rest of year’ returns following January’s return. It persisted for many decades in the US but appears to have largely disappeared in recent decades. The reasons for its disappearance are probably the same as for the disappearance of the original ‘January effect’ – widespread access to low cost computing, brokerage rates, futures markets and ETFs, that enabled investors to capitalise on the advantage until it was ‘arbitraged away’.
The Australian market had no such ‘rest of year’ momentum effect. If it existed at all in Australia it has disappeared since the 1990s, as in the US.
It is a reminder to always try to get behind the numbers and understand the fundamental causes and effects before committing investors’ funds to what seems to be a seemingly high correlation suggesting an opportunity for outperformance.
Ashley Owen (BA, LLB, LLM, Grad. Dip. App. Fin, CFA) has been an active investor since the mid-1980s, a senior executive of major global banking & finance groups, and currently advises UHNW investors and advisory groups in Australia and Asia. This article is general information and does not consider the personal circumstances of any individual.