Many readers understand the inverse relationship between bond prices and bond interest rates. Bonds usually carry a fixed coupon payment that reflects interest rates at the time of issue, and the promise to pay the principal back at maturity. Once bonds start trading in the secondary market, the price of the bond can change with the yield – remember the coupon payments are fixed - moving in the opposite direction to the price.
Investors overlook that the relationship between interest rates and values applies to all income-producing assets.
Think of a rental investment property with a stable tenant who pays the same rent every week for decades. The income from the property stays the same so the payment of a higher price for the property results in a lower yield and the payment of a lower price for the property results in a higher yield.
I have deliberately introduced property as an example to help explain that it is not only bonds that share an inverse relationship with interest rates. And that’s important to keep in mind when one considers the structural change in the stance of central banks around the world, which we will come to in a moment.
The higher the price, the lower the return
An unforgettable investing rule is the higher the price you pay, the lower your returns. If, for example, a non-dividend-paying company’s shares trade at $40 in November 2029 – say 10 years from now – then paying $10 for them today will deliver a 14.86% compounded annual return. But paying $21 for those shares today, the return drops to 6.6%.
Flipping this, if a business generates $40 of cash flow in January 2029, what is that future $40 worth today? The answer depends on the rate used to ‘discount’ that future cash flow back to today. If we demand a 15% return on our investment over the next 10 years, the value of that future $40 is worth $9.89 today. If we are satisfied with a 6.6% annual return on our money, then that future $40 is worth $21 today.
By lowering the rate of investment return from 15% to 6.6%, we increase the present value of a future cash flow from $9.89 to $21. In other words, when interest rates (required returns) fall, the value of an asset rises. The reverse is also true. In the example above, if interest rates rise from 6.6% to 15%, the value of that future $40 falls from $21 to $9.89.
The rule applies to all assets
As interest rates rise, asset values fall. It applies to all income-producing assets – businesses, shares, property, bonds. And as the value of income-producing assets fall, banks are less inclined to lend, which reduces liquidity and the money available to speculate on non-income-producing assets such as art, wine, cars and low digit number plates.
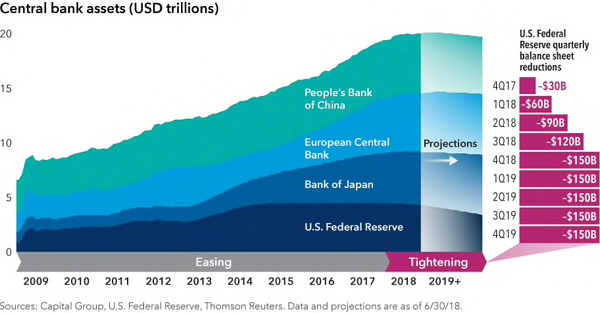
The chart above follows the rapid growth in central bank balance sheets since 2009 when they collectively commenced the greatest monetary experiment of our time. They paid cash to banks and investors for their bonds and pushed bond prices up and yields down.
The hitherto ‘building up’ of central bank balance sheets has now gone into reverse as the US Fed started reducing its balance sheet by allowing bonds to mature, and through the cessation of purchasing more. Meanwhile, the Bank of Japan (BoJ) and the European Central Bank (ECB) have entered Quantitative Tapering by reducing their purchases initially, followed by presumably ceasing altogether.
What happens when you remove from the bond market the biggest constant buyers of bonds in the last 10 years? Bond prices stop going up and start falling and bond yields stop going down and start rising.
In addition to the biggest buyers being removed, a new seller has emerged in the form of the US Treasury issuing bonds to fund Donald Trump’s fiscal deficits. Remember all those tax cuts? The hole left in the budget from the reduction in tax revenue needs to be plugged with borrowings and that means an increase in the supply of bonds.
Why 2018 was a transition year
Take out the biggest bond buyer and introduce a new large seller and bond prices go down and yields go up. The difference this time around is that it appears to be structural rather than cyclical and the quantum of the change may yet overwhelm other typical influences on bonds.
It makes 2018 a transition year. Although US 10-year bond rates have been rising for more than two years - from a low of 1.36% in 2016 to more than 3.2% late last year - the stock market only seemed to react last year. As is often the case when rates start rising, the markets were initially buoyed by the economic growth that typically accompanies rising rates.
Eventually, the exuberance about inchoate economic growth gives way to concerns about the effect on asset values from rising rates. At that juncture, Price/Earnings ratios are generally extended thanks to the prior exuberance.
Consequently (and especially if rates keep rising), those investors who paid record prices for everything from property to collectibles may now experience poor returns. The only question is whether those lower returns are accompanied by higher volatility as well.
Switch from corporate to government bonds
The higher yields on government bonds are starting to look more attractive. Consequently, investors who were overweight corporate bonds are selling those bonds, pushing their yields higher too. You can see this in the market value of Corporate Bond ETFs such as the iShares IBoxx US Dollar Investment Grade Corporate Bond Fund (NYSEARCA:LQD), which has fallen from over US$116.00 to US$111.00 since August 2018. Yes, bond ETF prices can fall and are not as defensive an asset as many think.
The switch from US corporate bonds to US Treasuries is occurring at a time when a record 47% of all US corporate bonds are rated the lowest BBB investment grade, and 14% of S&P1500 companies are considered ‘zombie’ companies unable to pay their interest from earnings before interest and tax. I would not be surprised, as interest rates on these bonds rise, that the high levels of leverage results in a significant number of downgrades to these BBB bonds by the ratings agencies.
Perhaps even more worrying, a credit market record level of CCC-rated high yield (previously called 'junk') debt is due to be refinanced in 2019 and 2020.
It all suggests more volatility. For investors who remember the rule about higher prices and lower returns, they may already have a stash of cash ready to take advantage of opportunities.
Roger Montgomery is Chairman and Chief Investment Officer at Montgomery Investment Management. This article is for general information and does not consider the circumstances of any individual.