Register For Our Mailing List

Register to receive our free weekly newsletter including editorials.

Home / 641

Retirement affordability myths

Of the many challenges in the world of retirement income, one of the most frequently noted is the lack of understanding and engagement displayed by ordinary Australians as they approach retirement. ‘If only pre-retirees engaged more, they’d be so much better off’, industry and regulators say.

But is it possible that this problem has been inadvertently created by industry itself, through the peddling of false dreams and entirely unrealistic retirement affordability targets?

The promise of a ‘worry-free life’ once the money is sorted? And that money can be sorted by simply joining the ‘right’ fund or purchasing the ‘right’ lifetime income stream?

The fact is that consumers aren’t buying this dream.

The overwhelming concern of most Australians is still the fear of running out. FORO continually tops the list of reported retirement worries. Somewhat ironically, this fear, too, is false.

Except for those in extreme disadvantage – no one in Australia actually runs out – the Age Pension ($46,202 couples combined, $30,646 for singles) remains a reasonable safety net for most.

So why do intelligent men and women say this is their greatest concern?

Could it be they have checked out the numbers in the most popularly quoted ‘retirement standard’ target and the amount of money needed for most is just a pie in the sky?

The ‘messy middle’

Let’s zoom out and look at the broader context of Australians in retirement. There are currently 4.5 million retirees with another 2.5 million expected to join them over the next 10 years. Yet many of these Australians are stumbling into retirement poorly prepared, confused, sometimes financially stressed… or simply switched off. An example of poor preparation can be seen in AMP research (2023) which revealed that 70% of over 50-year-olds do not know what an Account-Based Pension (ABP) is.

Those in retirement can be grouped into three different income profiles:

  • 20% on struggle street: According to Treasury (Retirement Income Review, 2020), renters represent about 15% of retirees, with about another 5% in share home arrangements or residential aged care.
  • The so-called ‘top’ 20%: About 30-35% of Australians entering retirement are self-funded. But as assets are spent down, according to the Retirement Income Review, 80% of Australians will receive at least a part-pension entitlement in their 80s, so only 20% will be fully self-funded throughout their full retirement.
  • 60% in the ‘messy middle’: So that leaves us with the 60% in the ‘messy middle’ – the core 60% or so of retirees who enter retirement with Age Pension support and some super top-up.

How do we set retirement saving targets?

Now let’s consider three very different targets:

  • ASFA Retirement Standard
  • Super Consumers Australia
  • Retirement Affordability Index

and how helpful they are for those in the messy middle trying to project a realistic retirement pay cheque.

The ASFA Retirement Standard

First established by the Association of Super Funds Australia (ASFA) in 2004, initial targets for ‘comfortable’ retirements suggested the need for savings as high as $1 million. That may have been seen as aspirational by a few, but it killed interest in active retirement planning for many more pre-retirees who knew they would never get near that amount. The current ASFA targets for ‘comfortable’ for those aged 65-85 are:

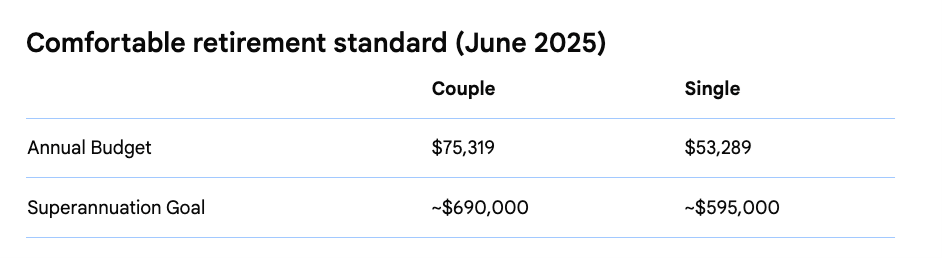
Do these amounts reflect what is happening in real life. As released by the Australian Tax Office (ATO) earlier this year, the median male super savings at retirement age (65-69) is $218,000 and for a female, $199,000. So actual super savings, for about half the cohort, represent barely one third of the amount in the ASFA targets for ‘comfortable’. Does this force us to assume most Australians will not be comfortable in retirement? This comfort relies, of course on fully owning your own home. But the sharp increase in household mortgages has been well documented by Rachel Ong ViforJ and Harry Chemay – more than 50% of 55-59 year olds (i.e. tomorrow’s retirees) are carrying mortgage debt.

More recently ASFA has at last acknowledged the presence of renters. But the amounts ASFA suggests are needed by those who rent are surprising - $66,296 for couples and $49,000 for singles. Renters in retirement do not have anywhere near these amounts. They are most likely to be full Age Pension status – singles $30,646, couples $46,202. Even with Commonwealth Rent Assistance, they are a long way from these income targets. As the Grattan Institute confirms, “75 per cent of retired renters have total assets, including any car and personal effects, of less than $125,000.”

So if you were heading into retirement and saw these targets, but you had just the median amount of super for your age – would they be helpful? Would they encourage you to work with an adviser and map out your future? Or would you think, as so many do, ‘I don’t have enough to worry about– I’m probably going to have to work forever, assuming my health holds out.’

Enter Super Consumers Australia (SCA)

In March 2022, SCA recognised the need for a reality check and conducted a consultative enquiry into what ordinary Australians might need to live on after full-time work.

Here are SCA’s latest savings targets for retirees and pre-retirees*:

Savings targets for current retirees (aged 65)

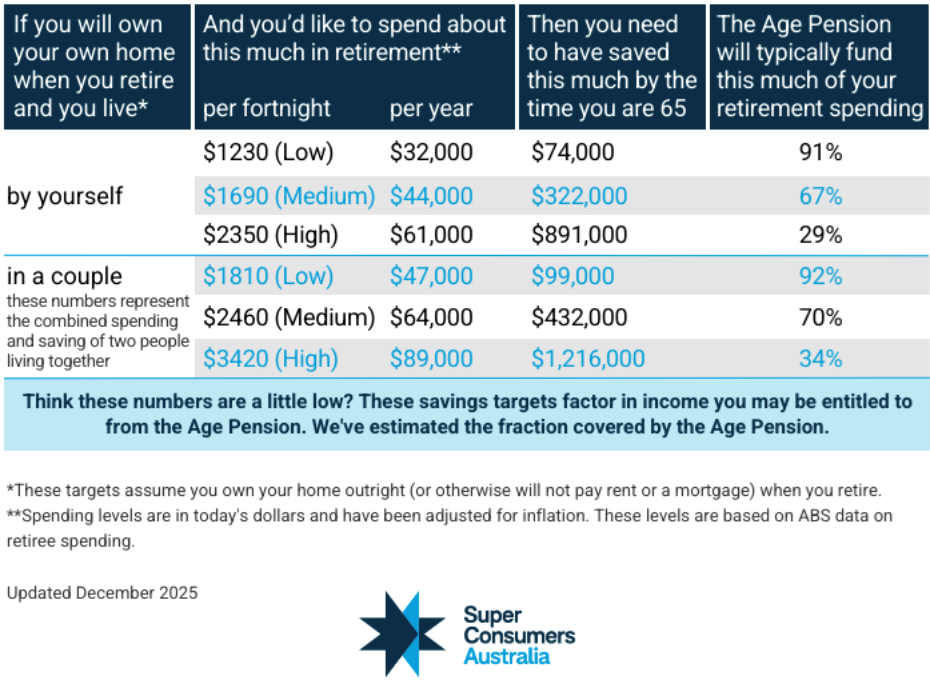
These target amounts are much more in line with what is happening if we consider the 20/60/20 framework of retirees. The high amounts are higher than ASFA, the low amounts are in line with Age Pension payments and those in the middle, with the exception of singles, are closer to median amounts. They do, however, continue to assume homeownership and/or no mortgage costs or rental expenses.

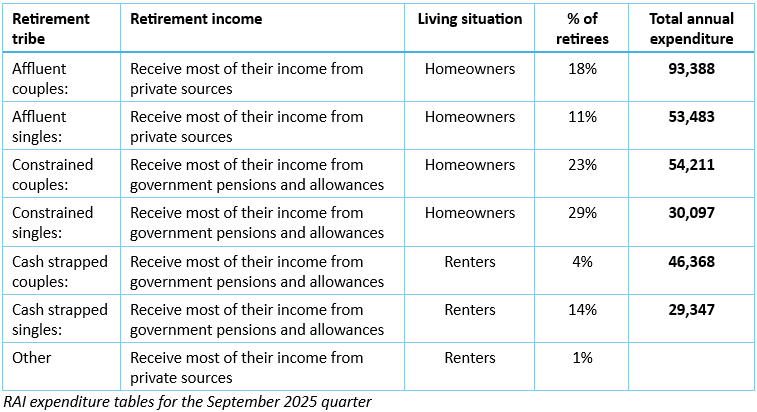
The Retirement Affordability Index

Although somewhat below the radar, I would suggest the Retirement Affordability Index (RAI), first published in March 2017, is much more useful for ordinary Australian retirees. Full disclosure: I took the ‘problem’ of retirement living spending to Matt Grudnoff, senior economist at The Australia Institute (TAI). Matt had previously worked at the ABS and understood their data well. From inception, the purpose of this index was to offer an ongoing report on how much retirement actually costs, depending upon your very individual circumstances or ‘tribe’, including those who rent. This data is based not upon a basket of goods but actual household spending for these different profiles. It is adjusted every quarter for CPI.

Matt created the index based upon the ABS Household Expenditure Survey (HES), but specifically cut into the following six tribes:

Are these annual spending targets perfect?

No. The HES was last published by the ABS in 2015. It was due to be updated in 2020 but skipped due to the Covid lockdowns which would have distorted the data. I am informed that research is in the field at the moment and will be available in early 2026, when we can completely update the Retirement Affordability Index.

That said, both Matt and I believe this index provides fact-based spending information to enable current Australian retirees to calculate their future income needs.

How liveable is a ‘median’ retirement?

Regardless of a preference for one index over another, how can industry provide reliable expectations with those who are struggling to understand what they will need in retirement?

Here is a projection (provided by Retirement Essentials) of what median super savings might provide when combined with an Age Pension entitlement. The case study shows a couple, aged 67, who are homeowners with median combined super of $417,000, $30,000 bank savings and $20,000 in household contents.

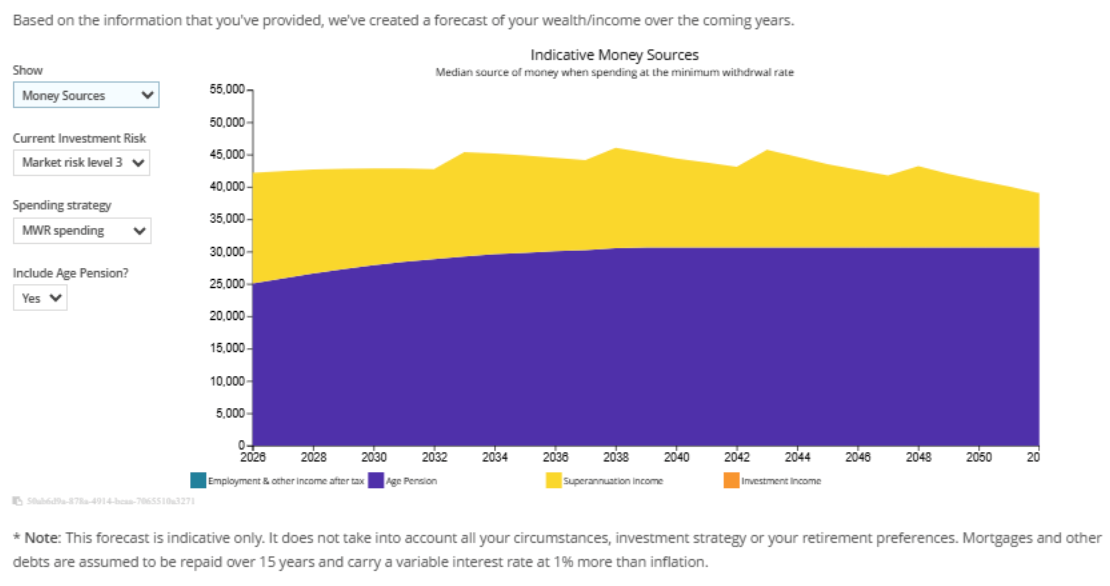
This is what situation normal looks like

These median savings will convert to a retirement pay cheque of $40,000-45,000 per annum over time.

  • This couple will not have $75,000 to meet the ASFA comfortable standard.
  • They will not have $64,000 which would meet the ‘medium’ category from Super Consumers Australia.
  • Nor will they have $54,000 to match the ‘constrained’ tribe in the Retirement Affordability Index.

Instead, they will live on about $10,000 less. But nor will they actually run out!

This ‘situation normal’ picture is the one that industry needs to explain in order to encourage interest and engagement from ordinary retirees. Talking ‘real’ targets, not aspirational ones, will help them manage their expectations while making the most of what they have.

And by sharing ‘situation normal’ rather than ‘pie in the sky’ targets we can introduce another important message. That the sooner retirees engage with more achievable, realistic targets, the sooner they can get active on their own behalf. This means learning the rules they need to know, considering mortgage management options, taking advantage of super concessions and perhaps working longer.

Above all else, taking control of spending to maintain maximum control over their own financial futures.

The role of industry is to ensure that our stories are relatable and realistic – and that the targets are truly affordable.


Kaye Fallick is an independent retirement commentator and author, www.kayefallick.com. This article is general information and does not consider the circumstances of any person.

This is an edited extract from Kaye’s presentation at the CEPAR 33rd Colloquium on Pensions and Retirement Research in November 2025 at UNSW.
*SCA targets at CEPAR were from January 2025, now updated to December 2025 for this article.


  •   10 December 2025
  • 31
  •      
  •   
31 Comments
Paul
December 11, 2025

Great article Kay. I've always thought the ASFA 'comfortable' index should be renamed the 'affluent' index, as only a relatively small percentage of Australians will retire with this level of retirement assets / drawn income.

And while SCA's model is more grounded in what people are moire likely to have/spend, it's a useful 'bookend' to the ASFA model.

But I'm pleased to read that the much needed 2025/26 update of the ABS' survey of actual and 'applied' retirement spending is in train and hopefully will land in early 2026 and provide a more realistic yardstick of how Australians are actually spending in their retirement.

I expect that the results are likely to materially differ from the 2015 survey which has been routinely updated by CPI. This I expect will be due to several factors: firstly, as the 'cost of living crisis', largely fuelled by eye-watering housing property inflation (based on a range of metrics and recent reports, Australian house prices are widely considered on an international measure to be in the "severely unaffordable" to "impossibly unaffordable" range, particularly in the major capital cities), is a quite different landscape to 2015. Secondly, wage increases over this period have not kept pace with inflation, nor has the Age Pension, which is indexed to AWOTE, not CPI. Thirdly, the current 'sandwich' generation of retirees have arguably never been so challenged by aged parents needing costly assistance and children seeking 'living inheritiace' assitance from the bank of Mum and Dad, to leave the next and get on one of the world's scariest property ladders.

So, my predection: retirees actually spending more than their 2015 counterparts, but well less than ASFA's benchmarks and something closer to SMC's numbers.

However, what the data won't tell us, but is really one of the key questions, is to what extent these actual spending numbers are a result of people choosing these amounts, irresepctive of their means or whether, as I more suspect is the case, they would like to consume more, but their means doesnt allow for it, so they have somewhat accepted their financial lot in retirement and have adjusted their lifestyle to what they feel they can afford, bearing in mind the omnipresent "FORO" shadow they feel is cast over them.

Kay, it would be great to see you update this article once the ABS results are out and assessed, and potentially with a qualitative overlay relatng to the above behavioural drivers behind the results.

3
Dudley
December 11, 2025


"the ASFA 'comfortable' index should be renamed the 'affluent' index, as only a relatively small percentage of Australians will retire with this level of retirement assets / drawn income.":

'Comfortable retirement standard (June 2025) ... $75,319'
'the median male super savings at retirement age (65-69) is $218,000 and for a female, $199,000'
Total $417,000.

Drawdown for home owner couple with $417,000 Age Pension Assessable Assets:
= PMT(((1 + (1 - 0%) * 4.5%) / (1 + 2.5%) - 1), (87 - 67), -481500, 0) + (26 * 1777)
= $71,584 / y.

The median couple has the capital and income to afford an Association of Super Funds Australia (ASFA) defined Comfortable Retirement.

2
Dudley
December 11, 2025


Err;
= PMT(((1 + (1 - 0%) * 4.5%) / (1 + 2.5%) - 1), (87 - 67), -471000, 0) + (26 * 1777)
= $71,584 / y.

1
Dudley
December 11, 2025


Err;
= PMT(((1 + (1 - 0%) * 4.5%) / (1 + 2.5%) - 1), (87 - 67), -417000, 0) + (26 * 1777)
= $71,584 / y.

1
Mark S.
December 12, 2025

Dudley,
What if there was a genuine push for Gov't legislation change to allow the combing of the "Median Couples" ABP Super accounts into a single account ($417,000). Surely this would reduce fees & charges and present higher returns over their 25+ year retirement period. Perhaps we may see a jump for the "Median Couple" from "Comfortable" to "Affluent"?
SMSF's have Couples, why not ABP's?

Kaye
December 11, 2025

Hi Paul, thanks for this very thoughtful feedback - I agree with your insights and also suspect the nature of retiree spending will have shifted quite a lot since the last HES. And yes, we will update the tables and share a summary of the main factors behind any significant shifts that may occur. Anecdotally, it seems that minimum withdrawal rates are often perceived to be government recommended withdrawal rates regardless of the size of savings ... which suggests some educational effort on this topic might be needed? thanks again, Kaye

Dudley
December 12, 2025


"minimum withdrawal rates are often perceived to be government recommended withdrawal rates regardless of the size of savings":

Where is the income tax rate less than or equal to 0%, that of a Super Disbursement ('pension') Account?

Answer:
Home owner SAPTO couple with individual incomes both less than or equal to $31,887.
Marginal tax rate for $31,888 is 26% due to roll off of tax offsets.
$31,887 / 4.5% = $708,600. Each.
May as well leave as much as possible in super and withdraw as required.

Stuffing the capital into home incurs various taxes such as GST and taxes trade workers incomes but that can result in reduced Age Pension Assessable Assets and sufficient increased Age Pension payments to more than offset the said taxes.

Dudley
December 12, 2025


"SMSF's have Couples, why not ABP's?"
SMSF has individual accounts.
What fees saved?
https://www.google.com/search?&q=unisuper+fees

Mark S.
December 12, 2025

Mr Couple has $218,000.00 in his ABP Super Fund account, his annual management fees & costs are approximately $1,500.00
Mrs Couple has $199,000.00 in her ABP Super Fund account, her annual management fees & costs are approximately $1,500.00
$3,000.00 x 25 years = $75,000.00 in fees saved? Plus, additional investment returns?

Dudley
December 13, 2025


https://www.unisuper.com.au/-/media/files/pds/ibr/fees-and-costs.pdf

"Mr Couple has $218,000.00" fees:
= MIN(96, 2% * 218000) + (0.43% * 218000) + (0.08% * 218000)
= 1207.8
"Mrs Couple has $199,000.00" fees:
= MIN(96, 2% * 199000) + (0.43% * 199000) + (0.08% * 199000)
= 1110.9
Total:
= 2318.7

Couple:
= MIN(96, 2% * 417000) + (0.43% * 417000) + (0.08% * 417000)
= 2222.7

Difference:
= -96 (one administration fee)

"$3,000.00 x 25 years = $75,000.00 in fees saved?":
How to avoid? SMSFs pay fees:
https://www.google.com/search?q=SMSFs+accounting%2C+audit%2C+ato+levy%2C+investment+fees

1
Jay
December 11, 2025

Excellent article- finally a retirement income article focussed on the reality, not the fantasy!

I was a teenage part time worker when compulsory super was introduced and am a decade or so off retirement.

Is it safe to assume that my generation - the first to essentially to have been paying into super for our entire working life - are likely to have higher average super balances on retirement than generations past which I assume the source groups for the current average super balance of circa 200k?

1
Kaye
December 11, 2025

Hi Jay, thanks for your comments. The question you raise is a good one - and I will leave it to the actuaries in the Firstlinks community to respond in detail. But yes, the longer term super contributions (and higher ones than the original percentage of salary in 1992) will mean you have a higher balance than the current cohort of retirees. However the critical asset for a truly secure retirement has to be an unencumbered home. A large balance is great, but not if most of it goes on wiping out a mortgage and you are then left with little to draw down over the years. warmest Kaye

Dudley
December 11, 2025


Drawdown not considered.

Tax 0%, gross return 4.5%, inflation 2.5%, to 87 from 67, capital Present Value $481,500, capital Future Value $0, fortnights / y 26, Age Pension home owning couple $1,777 / f;
After tax, after inflation drawdown:
= PMT(((1 + (1 - 0%) * 4.5%) / (1 + 2.5%) - 1), (87 - 67), -481500, 0) + (26 * 1777)
= $75,510 / y.

After tax, after inflation, after saving income:
= (((1 + (1 - 0%) * 4.5%) / (1 + 2.5%) - 1) * 481500) + (26 * 1777)
= $55,597 / y.

= (((1 + (1 - 0%) * 4.5%) / (1 + 2.5%) - 1) * 481500) + (26 * 1777)

1
Franco
December 11, 2025

Dudley im just letting you know that most readers are not really understanding your regular input.
Maybe using words and sentences to explain your calculations would help them.
Just a thought

20
Dudley
December 11, 2025


Drawdown is withdrawal of money from super capital to personal capital.

PMT [ PayMenT ] is a spreadsheet function:
https://www.google.com/search?q=spreadsheet+function+PMT


1
Dan
December 11, 2025

I agree Franco. I find the calculations insightful when I understand them, however, often over my head.

I think the first one is basically saying a 20 year retirement, initial nest egg of $481,500, drawn down to zero (with inflation at 2.5%) will be $75,510 p.a

The second one is the same assumptions BUT preserves the nest egg and only spends the investment return above inflation. In doing so, they can spend $55,597 pa. However, on the various measures above, this is tightening the belt a lot for a couple.

That's my interpretation of the formulas. Could be wrong...

2
Dudley
December 11, 2025


"BUT preserves the nest egg":

That's it - sufficient income saved to maintain value of capital considering inflation.

Dudley
December 11, 2025


"BUT preserves the nest egg",
Equivalent using PMT() with the capital Future Value adjusted for inflation made more obvious":

= PMT(((1 + (1 - 0%) * 4.5%) / (1 + 2.5%) - 1), (87 - 67), -481500, 481500) + (26 * 1777)
= $55,597 / y.

Dudley
December 13, 2025


"readers are not really understanding your regular input":

Much easier to understand and customise when the formulae are copy and paste into a spreadsheet.

Beginners Google Sheets Tutorial - Lesson 1
https://www.youtube.com/watch?v=G93P4DxryVE


Tony Dillon
December 14, 2025

“I think the first one is basically saying a 20 year retirement, initial nest egg of $481,500, drawn down to zero (with inflation at 2.5%) will be $75,510 p.a”

Almost right Dan. The $75,510 includes 26 x $1777 annual aged pension. Take that out and Dudley’s formula = $29,309 p.a.

Dudley’s use of excel formulae is indeed informative for some, at least anyone with some excel skills. Understandably it’s not for everyone. However, the formula here collapses a lot of cash flow into a single figure, and sometimes you lose some perspective as to what is actually happening. Below I have done a cash flow projection to prove what Dudley is saying through his formula. Full cash flow also allows you to look at what’s happening at each interval of time. It is instructive and I think can help with understanding of what’s going on.

The projection inflates the payment annually (at 2.5%) and accumulates the fund at the gross of inflation earning rate (4.5%). The last two columns bring the annual payments and end fund value back to today's dollars (inflation adjusted).

Fund 481,500
Earning rate 4.50%
Inflation rate 2.50%
Payment 29,309

Nominal Inflation adjusted (to today's $s)
Year Fund start Payment Fund end Payment Fund end
1 481,500 30,041 473,126 29,309 461,587
2 473,126 30,792 463,625 29,309 441,285
3 463,625 31,562 452,926 29,309 420,587
4 452,926 32,351 440,956 29,309 399,485
5 440,956 33,160 427,639 29,309 377,971
6 427,639 33,989 412,894 29,309 356,037
7 412,894 34,839 396,636 29,309 333,676
8 396,636 35,710 378,775 29,309 310,878
9 378,775 36,602 359,217 29,309 287,636
10 359,217 37,517 337,865 29,309 263,939
11 337,865 38,455 314,613 29,309 239,781
12 314,613 39,417 289,354 29,309 215,151
13 289,354 40,402 261,973 29,309 190,041
14 261,973 41,412 232,350 29,309 164,440
15 232,350 42,447 200,358 29,309 138,340
16 200,358 43,509 165,865 29,309 111,731
17 165,865 44,596 128,733 29,309 84,603
18 128,733 45,711 88,815 29,309 56,945
19 88,815 46,854 45,957 29,309 28,748
20 45,957 48,025 0 29,309 0

This outcome matches: PMT(((1 + (1 - 0%) * 4.5%) / (1 + 2.5%) - 1), (87 - 67), -481500, 0) = $29,308.52

Dudley's other formula varies the payment such that the initial capital is retained after 20 years. That is,

PMT(((1 + (1 - 0%) * 4.5%) / (1 + 2.5%) - 1), (87 - 67), -481500, 481500) = $9,395.12

Again, the cash flow supporting that result:

Fund 481,500
Earning rate 4.50%
Inflation rate 2.50%
Payment 9,395

Nominal Inflation adjusted (to today's $s)
Year Fund start Payment Fund end Payment Fund end
1 481,500 9,630 493,538 9,395 481,500
2 493,538 9,871 505,876 9,395 481,500
3 505,876 10,118 518,523 9,395 481,500
4 518,523 10,370 531,486 9,395 481,500
5 531,486 10,630 544,773 9,395 481,500
6 544,773 10,895 558,392 9,395 481,500
7 558,392 11,168 572,352 9,395 481,500
8 572,352 11,447 586,661 9,395 481,500
9 586,661 11,733 601,328 9,395 481,500
10 601,328 12,027 616,361 9,395 481,500
11 616,361 12,327 631,770 9,395 481,500
12 631,770 12,635 647,564 9,395 481,500
13 647,564 12,951 663,753 9,395 481,500
14 663,753 13,275 680,347 9,395 481,500
15 680,347 13,607 697,356 9,395 481,500
16 697,356 13,947 714,789 9,395 481,500
17 714,789 14,296 732,659 9,395 481,500
18 732,659 14,653 750,976 9,395 481,500
19 750,976 15,020 769,750 9,395 481,500
20 769,750 15,395 788,994 9,395 481,500

(apologies if the formatting is askew)

3
Dudley
December 14, 2025


"Full cash flow also allows you to look at what’s happening at each interval of time. It is instructive and I think can help with understanding of what’s going on.":

Yes.

Needs beginner spreadsheet skills.

Dudley
December 14, 2025


"understanding of what’s going on":

This format may help:

Year 0 Net 1.95% =(1 + 4.5%) / (1 + 2.5%) - 1
Year 1 Principal =Year 0 Principal + Year 1 Net + Year 1 Payment.

Year 0 Payment is found experimentally by manually changing Year 0 Payment until Year 20 Principal is 0 or close to. [ Can also use Goal Seek or Solver to semi-automate ]

Year Net Payment Principal
0 1.95% -29,309 481,500
1 9,395 -29,309 461,587
2 9,007 -29,309 441,285
3 8,610 -29,309 420,587
4 8,207 -29,309 399,485
5 7,795 -29,309 377,971
6 7,375 -29,309 356,037
7 6,947 -29,309 333,676
8 6,511 -29,309 310,878
9 6,066 -29,309 287,636
10 5,612 -29,309 263,939
11 5,150 -29,309 239,781
12 4,679 -29,309 215,151
13 4,198 -29,309 190,041
14 3,708 -29,309 164,440
15 3,209 -29,309 138,340
16 2,699 -29,309 111,731
17 2,180 -29,309 84,603
18 1,651 -29,309 56,945
19 1,111 -29,309 28,748
20 561 -29,309 0

Or could calculate using:
= PMT((1 + 4.5%) / (1 + 2.5%) - 1, 20, -481500, 0)
= $29,308.52 / y.

Tony Dillon
December 14, 2025

Correct Dudley. Accumulating at a net of inflation earning rate achieves the same inflation adjusted results. You just don't see what the nominal values by year are.

Dudley
December 15, 2025


"nominal values by year"

= RealValue * (1 + InflationRate) ^ (EndYear - StartYear)

or

= RealValuePriorYear * (1 + InflationRate)

Converting Real values to Nominal values does not add much information.

Tony Dillon
December 15, 2025

Dudley, there may be a number of reasons why nominal figures are useful. Eg. for budgeting. People may need to anticipate actual cash in the future regardless of its value in today's terms. An individual's rate of inflation might be different to that projected by funds, and it might vary from year to year. So might as well have nominal figures ready to go for individual adjustment. Many financial arrangements only deal with nominal, like loan schedules. Nominal figures can be better understood by people. I could go on. Might as well just pump the nominal numbers out to begin with which can then be adjusted for inflation if need, rather than the other way around.

Dudley
December 15, 2025


"rather than the other way around":

6 of one, half dozen of the other.

Using the net real rate in the formulae allows the use of real FutureValue as input parameter.
PMT output being value at time 0, ie net real value. PMT at time N, multiply by (1 + InflationRate) ^ N.
FV output being real value at time N, which can be converted to nominal value by multiplying by (1 + InflationRate) ^ N.

To convert Nominal to real, multiply by the reciprocal, 1 / ((1 + InflationRate) ^ N)


Ram
December 11, 2025

I'm single, retired for about 12 years and own my home. I maintain a spreadsheet of expenses. In my first retirement year, over a 6-month period of living very comfortably, I came to an average figure of approx 60,000 per year. In another lot of six months, I was very careful about spending and came to an average of approx 40,000 per year. It's old school, but works for me.

1
Kaye
December 11, 2025

Hi Ram, that's impressive. Having a budget, and keeping to it, has to be the secret sauce for any successful retirement, doesn't it? Many people approaching retirement are unsure what they spend each year. Many also under estimate the amount. Ouch!

Peter Vann
December 12, 2025

Thanks Kaye, IMHO there needs to be more discussion on retirement adequacy, particularly at the member coalface, and as you highlight, there is a mixed bag of thoughts from industry bodies.

I personally believe that this is the most important challenge faced by the retirement industry. If the delivery of this topic can be improved so members can understand where they stand and what they can do to improve their adequacy, then most other issues (albeit important issues like age pension, what is an account based pension etc) should be well managed as support functions by service providers. The industry puts up toooooo many “barriers” of complexity.

Some of my simple observations:
1 RETIREMENT PAYCHEQUE
Kaye, I’m glad to see you use this term since provides more continuity of terms used during one’s working years, e.g. salary, pay, paycheque. This overcomes much confusion in retirement flowing from use of terms like drawdown, retirement income, etc (eg as seen in recent comments on this forum).

2 RETIREMENT COHORTS
More readily available and simple discussion is needed regarding retirement adequacy for a range of cohorts. Perhaps a simple starting point can be based on member salary bracket; this is possibly easier to do and more relevant for those who working income is (was) up to or a bit above FT AWE.

3 ADEQUACY of current SGC
So much discussion about this with a range of conclusions. My two bob is:
If someone (or a couple) has contributed current 12% SGC of median working income from age 25 to retirement at 67, they have a good chance** of funding an annual retirement paycheque***, within a range 20% below their annual working post tax income, whilst they (or at least one of a couple) are alive.

4 RETIREMENT CALCULATORS
What a mess! From some recent comments on Firstlinks it is apparent that some of their readership, who are engaged, are confused.
BTW, Kaye I think you should check the age pension numbers in the graph above, they don’t seem to align to the couple in the example; I believe that their age pension is a bit less than the full couple age pension in early couple of years, $46k, due to deemed income and then they obtain the full couple age pension.


** I use 2/3rds probability of success for “good chance” within a stochastic retirement calculation accounting for investment and mortality risks.
*** retirement paycheque is sum of age pension (when eligible) plus withdrawal from retirement account (same as Kaye’s diagram above)

1
Tony Dillon
December 14, 2025

Great insights, thanks Kaye.

The SCA savings targets looked interesting so I went to the website to get some more detail on assumptions used in arriving at their numbers. It was a bit light on for detail, but did say they projected out 25 years to age 90. I then thought I’d have a go at replicating the high spend requirement for a couple of $89k, with the table saying they would need $1.216m at age 65, and with the age pension contributing 34% to their retirement spending to age 90.

To project cash flow I needed to make assumptions about future age pension amounts and future assets test thresholds. I assumed the age pension would increase by 2.5% p.a. and I used a slightly higher 2.75% p.a. increase for the thresholds. I assumed an annual earning rate of 4.5% and 2.75% inflation.

These are the results (last two columns inflation adjusted to today's $s, other columns nominal amounts).

Fund 1,216,000
Earning rate 4.75%
Inflation rate 2.75%
Payment 89,000

Year, Fund start, Fund payment, Pension payment, Fund end, Fund end (infl adj.), Total payment (infl adj.)
1 1,216,000 89,000 0 1,182,646 1,182,646 89,000
2 1,182,646 91,448 0 1,145,203 1,114,552 89,000
3 1,145,203 91,196 2,766 1,106,238 1,047,815 89,000
4 1,106,238 88,437 8,109 1,068,247 984,750 89,000
5 1,068,247 85,764 13,437 1,031,187 925,146 89,000
6 1,031,187 83,176 18,754 995,018 868,804 89,000
7 995,018 80,668 24,065 959,697 815,536 89,000
8 959,697 78,238 29,375 925,187 765,168 89,000
9 925,187 75,884 34,688 891,447 717,532 89,000
10 891,447 73,602 40,010 858,441 672,471 89,000
11 858,441 71,391 45,346 826,130 629,840 89,000
12 826,130 69,248 50,699 794,479 589,498 89,000
13 794,479 67,170 56,076 763,451 551,314 89,000
14 763,451 65,156 61,479 733,012 515,166 89,000
15 733,012 64,835 65,282 701,455 479,793 89,000
16 701,455 66,781 66,914 666,406 443,620 89,000
17 666,406 68,785 68,587 627,642 406,633 89,000
18 627,642 70,848 70,302 584,924 368,815 89,000
19 584,924 72,972 72,059 538,002 330,150 89,000
20 538,002 75,159 73,861 486,613 290,622 89,000
21 486,613 77,411 75,707 430,478 250,215 89,000
22 430,478 79,729 77,600 369,303 208,912 89,000
23 369,303 82,115 79,540 302,779 166,696 89,000
24 302,779 84,572 81,529 230,580 123,549 89,000
25 230,580 87,102 83,567 152,362 79,454 89,000

Analysis of payments:

Year, Fund payment (infl adj.), Pension payment (infl adj.), Total payment (infl adj.), %age pension payments
1 89,000 0 89,000 0.00%
2 89,000 0 89,000 0.00%
3 86,380 2,620 89,000 2.94%
4 81,524 7,476 89,000 8.40%
5 76,945 12,055 89,000 13.55%
6 72,625 16,375 89,000 18.40%
7 68,550 20,450 89,000 22.98%
8 64,706 24,294 89,000 27.30%
9 61,079 27,921 89,000 31.37%
10 57,657 31,343 89,000 35.22%
11 54,428 34,572 89,000 38.84%
12 51,381 37,619 89,000 42.27%
13 48,506 40,494 89,000 45.50%
14 45,792 43,208 89,000 48.55%
15 44,347 44,653 89,000 50.17%
16 44,456 44,544 89,000 50.05%
17 44,564 44,436 89,000 49.93%
18 44,672 44,328 89,000 49.81%
19 44,780 44,220 89,000 49.69%
20 44,888 44,112 89,000. 49.56%
21 44,995 44,005 89,000 49.44%
22 45,102 43,898 89,000 49.32%
23 45,209 43,791 89,000 49.20%
24 45,315 43,685 89,000 49.08%
25 45,422 43,578 89,000 48.96%
Totals 1,441,325 783,675 2,225,000 35.22%

So by the end of year 25 (age 90) in my calcs, the initial fund is almost exhausted as implied by SCA. And my numbers show that 35.2% of the retirement spending over the 25 years was funded by the age pension (pretty close to SCA’s 34%).

Some observations:

1. Part age pension commences in year 3.
2. Starting out small, the part age pension increases to 50% of the total annual payment by year 15, as assets run down.
3. By year 14, the couple receive the full age pension.
4. The age pension as a percentage of total income stays around the 50% level up to age 90, just before the savings run out.
5. From age 91, there are no savings left and the couple will live off the maximum pension only. So their income halves.
6. In reality, it is unlikely their annual spend requirement will remain constant (in inflation adjusted terms). As they age from 65, social spending will probably drop off as they get travel out of their system and so on. Health expenses could increase though. It is likely that annual spending will taper off towards full aged pension by age 90, rather than suddenly halve.

It’d be great if these organisations could publish full cash flows to give those going into retirement a clearer picture of where their cash flow might be at on a yearly basis. It would certainly help with their retirement planning, and may help with their ‘FORO’. Understandably, they will be very wary of their situation when presented with just two overarching numbers defining their retirement, being annual spend and total savings required. Those numbers need to be broken open to provide more detail and give retirees a higher level of confidence.

(Apologies for the presentation of numbers. It’s hard dumping out of excel into these comment boxes)

G Hollands
December 14, 2025

So what was the government worried about when it said that many superannuatants had money left in their super funds when they died. These figures show this theory is absolute dumbness.


Leave a Comment:

RELATED ARTICLES

Inflation cruels a comfortable retirement

Why it’s time to ditch the retirement journey

How much do you need to retire comfortably?

banner

Most viewed in recent weeks

Why it’s time to ditch the retirement journey

Retirement isn’t a clean financial arc. Income shocks, health costs and family pressures hit at random, exposing the limits of age-based planning and the myth of a predictable “retirement journey".

Australia's retirement system works brilliantly for some - but not all

The superannuation system has succeeded brilliantly at what it was designed to do: accumulate wealth during working lives. The next challenge is meeting members’ diverse needs in retirement. 

Australian stocks will crush housing over the next decade, 2025 edition

Two years ago, I wrote an article suggesting that the odds favoured ASX shares easily outperforming residential property over the next decade. Here’s an update on where things stand today.

The 3 biggest residential property myths

I am a professional real estate investor who hears a lot of opinions rather than facts from so-called experts on the topic of property. Here are the largest myths when it comes to Australia’s biggest asset class.

AFIC on the speculative ASX boom, opportunities, and LIC discounts

In an interview with Firstlinks, CEO Mark Freeman discusses how speculative ASX stocks have crushed blue chips this year, companies he likes now, and why he’s confident AFIC’s NTA discount will close.

Where to hide in the ‘everything bubble’

It might not be quite an ‘everything bubble’ but there’s froth in many assets, not just US stocks, right now. It might be time to stress test your portfolio and consider assets that could offer you shelter if trouble is coming.

Latest Updates

Investment strategies

History says US market outperformance versus Australia will turn

Much has been made of how US markets, especially the NASDAQ, have significantly outperformed the ASX over the past two decades. History suggests the pendulum will swing back once again in Australia's favour.

Investment strategies

Announcing the X-Factor for 2025

What is the X-Factor - the largely unexpected influence that wasn’t thought about when the year began but came from left field to have powerful effects on investment returns - for 2025? It's time to select the winner.

Economy

The illusion of progress

What is progress? Is it GDP growth? Increasing wealth? New and improving technology? This argues that our measure of progress has become warped, and we're heading backwards rather than forwards.

Strategy

Our favourite summer reads

Summer is a great time to catch up on a good book. Here is a list of books on leadership, investing, and well-being for those looking to learn, reflect, and gain inspiration over the holiday season.

Sponsors

Alliances

© 2025 Morningstar, Inc. All rights reserved.

Disclaimer
The data, research and opinions provided here are for information purposes; are not an offer to buy or sell a security; and are not warranted to be correct, complete or accurate. Morningstar, its affiliates, and third-party content providers are not responsible for any investment decisions, damages or losses resulting from, or related to, the data and analyses or their use. To the extent any content is general advice, it has been prepared for clients of Morningstar Australasia Pty Ltd (ABN: 95 090 665 544, AFSL: 240892), without reference to your financial objectives, situation or needs. For more information refer to our Financial Services Guide. You should consider the advice in light of these matters and if applicable, the relevant Product Disclosure Statement before making any decision to invest. Past performance does not necessarily indicate a financial product’s future performance. To obtain advice tailored to your situation, contact a professional financial adviser. Articles are current as at date of publication.
This website contains information and opinions provided by third parties. Inclusion of this information does not necessarily represent Morningstar’s positions, strategies or opinions and should not be considered an endorsement by Morningstar.