Small companies have been getting a lot of attention lately. The reason is that many investors are reassessing portfolios and preparing for the next cycle following any downturn which could be followed by a period of recovery.
In the past and during this type of cycle, small-caps have offered more upside than large caps because they had underperformed large-caps as the economy weakened.
Australian investors love small companies, but since the start of the S&P/ASX index series in 2000, the S&P/ASX Small Ordinaries have underperformed the large-cap dominated S&P/ASX 200 Index. But those backing the little companies should not despair.
Australian investors need to know where to look.
Small cap advantages
Now that the European Central Bank has eased, and it’s likely the US Federal Reserve may also start to deliver rate cuts sooner rather than later, investors are considering their portfolios for the next cycle.
Remember though, that rate cuts are usually in response to economic weakness and thus not bullish for equities. But this is where being small and nimble has its advantages.
Small companies tend to be domestic rather than internationally focused and more sensitive to the macro environment, historically underperforming in recessions and outperforming in expansions. Therefore, many investors are reassessing portfolios and preparing for the next cycle when rates are cut.
In the past, during this type of cycle, small caps have offered more upside potential than large caps because they have underperformed during the market downturn. But we think Australian investors should consider small companies beyond our shores because Australian small companies have not behaved the same way as small companies in other developed markets.
The S&P/ASX Small Ordinaries Index has delivered lower cumulative returns relative to the broader, large-cap dominated S&P/ASX 200 Index over the long term, and you can see in the chart below following the 2001 dotcom crash and the GFC, Australian small companies barely kept pace with their large-cap counterparts.
Chart 1: Australian small companies have underperformed Australian larger companies
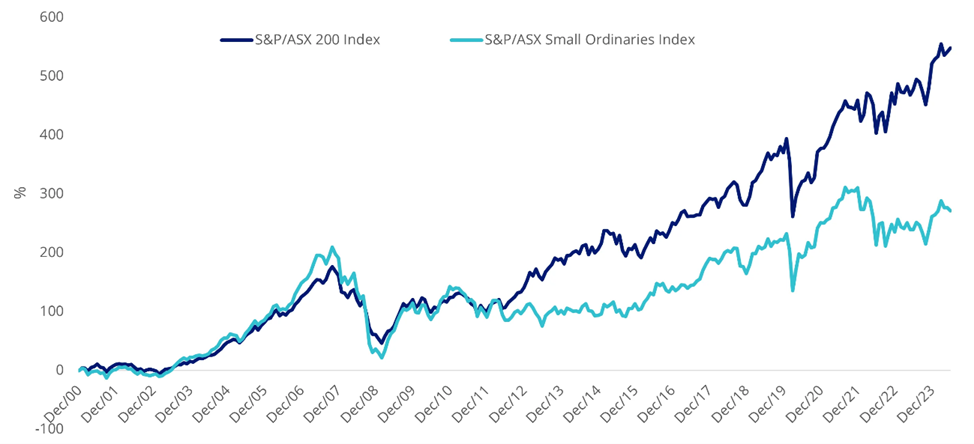
Source: Morningstar Direct, 30 December 2000 to 30 June 2024. Past performance is not indicative of future performance. You cannot invest in an index.
Look overseas
But let’s not forget small companies yet. Let’s look offshore.
If we consider global small companies, we can observe smaller firms, outperforming larger firms, on average. The MSCI World ex Australia Small Cap Index has outperformed the large-cap dominated MSCI World ex Australia Index over the long term.
Chart 2: International small companies have outperformed international larger companies
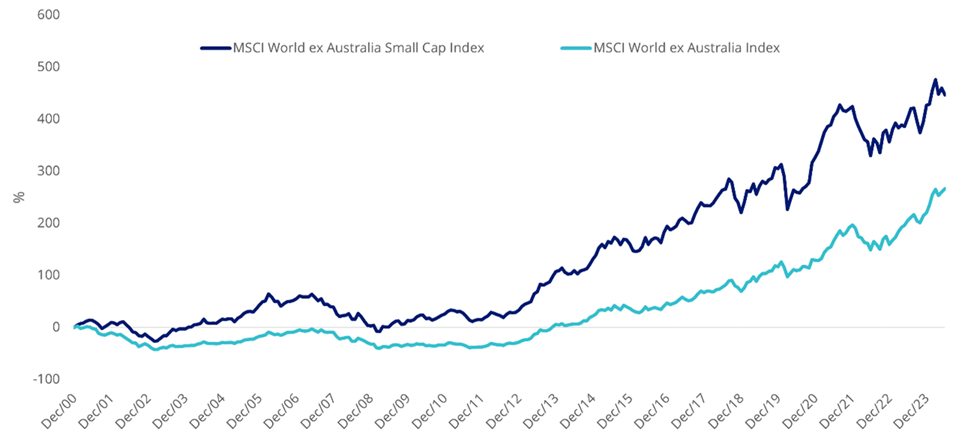
Source: Morningstar Direct, 30 December 2000 to 30 June 2024. Past performance is not indicative of future performance. You cannot invest in an index.
And, over the long term, global small companies have outperformed Australian small companies.
Chart 3: International small companies have outperformed Australian small companies
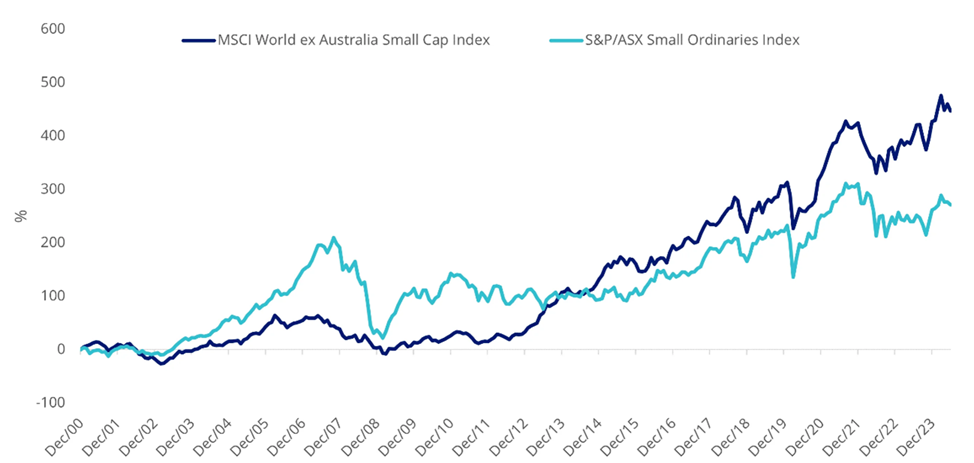
Source: Morningstar Direct, 30 December 2000 to 30 June 2024. Past performance is not indicative of future performance. You cannot invest in an index.
But most Australian investors do not have international small companies in their portfolios. The MSCI World ex Australia Small Cap Index (the International Small Cap Index) includes over 4,500 companies and there is no way they are all desirable from an investment point of view.
In terms of approaches, many Australian investors would be aware of our international quality ETF, QUAL which tracks the MSCI World ex Australia Quality Index and targets international companies with a high return on equity (ROE), low leverage and stable earnings. VanEck also offers the VanEck MSCI International Small Companies Quality ETF, with the ticker QSML, and it tracks the MSCI World ex Australia Small Cap Quality 150 Index. We affectionately call QSML “baby QUAL” because it harvests the Quality Factor, using the same fundamentals as QUAL, but in the international Small Cap universe.
So, let’s walk through the difference between QSML and the International Small Cap Index.
QSML vs International Small Cap Index – Fundamentals
Table 1: Statistics and fundamentals
|
|
QSML
|
International Small Cap Index
|
|
Index strategy
|
Smart beta – quality
|
Market capitalisation weight
|
|
Number of countries
|
12
|
22
|
|
Number of sectors
|
9
|
11
|
|
Number of holdings
|
149
|
3906
|
|
12mth trailing Dividend Yield
|
1.16%
|
2.0%
|
|
Dividend frequency
|
Annually
|
-
|
|
Return on equity (ROE) (%)
|
24.19
|
10.10
|
|
Financial leverage (debt to equity) (x)
|
0.43
|
1.47
|
|
Earnings per share (EPS) growth rate (%)
|
25.64
|
23.25
|
Source: VanEck, MSCI, FactSet, as at 30 June 2023. Past performance is not indicative of future results. You cannot invest directly in an index. International Small Cap Index is MSCI World ex Australia Small Cap Index.
As expected, QSML has higher ROE, lower debt to equity and a higher EPS growth rate.
QSML vs International Small Cap Index - Performance
Above we presented index data back to 2000. QSML was listed on ASX in March 2021. In that time, it has outperformed the International Small Cap Index. Based on back testing and accounting for QSML’s fees, QSML’s Index (net of QSML’s 0.59% p.a. management fee) displays long-term outperformance against the MSCI World ex-Australia Small Cap Index, as highlighted by the chart below. We always caution though past performance is not indicative of future results.
Chart 4: Modelled cumulative performance: QSML Index after fees1vs MSCI World ex Australia Small Cap Index
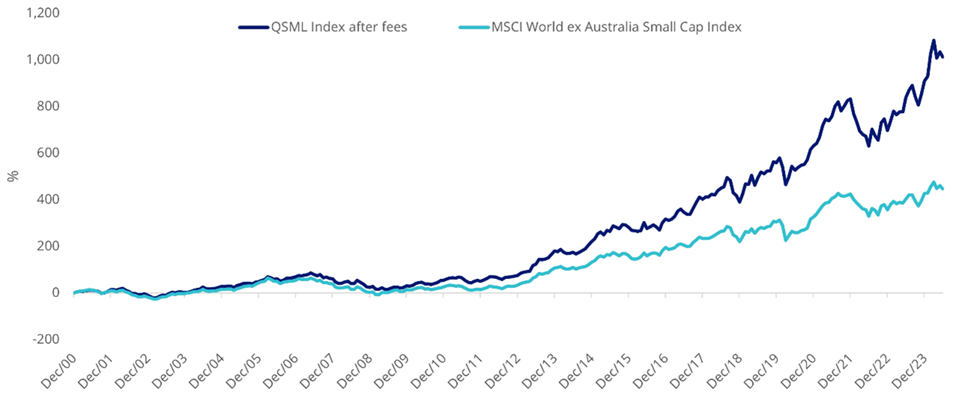
Table 2: Trailing returns: QSML, QSML Index after fees1vs MSCI World ex Australia Small Cap Index
|
|
1 month (%)
|
3 months (%)
|
6 months (%)
|
1 Year
(%)
|
3 Years
(% p.a.)
|
Since QSML Inception2
(% p.a.)
|
5 Years
(% p.a.)
|
10 Years
(% p.a.)
|
20 Years (%p.a.)
|
|
QSML
|
-2.07
|
-6.18
|
10.03
|
18.42
|
9.11
|
11.41
|
-
|
-
|
-
|
|
QSML Index (net of management fee)1
|
-
|
-
|
-
|
-
|
-
|
-
|
13.32
|
15.03
|
11.55
|
|
MSCI World ex Australia Small Cap Index3
|
-2.39
|
-5.08
|
3.72
|
8.81
|
2.67
|
5.19
|
7.98
|
10.09
|
8.07
|
|
Difference
|
+0.32
|
-1.10
|
+6.31
|
+9.61
|
+6.44
|
+6.22
|
+5.34
|
+4.94
|
+3.48
|
Chart 4 and Table 2 Source: VanEck, Morningstar, Bloomberg as at 30 June 2024. Past performance is not a reliable indicator of future performance. Results are calculated to the last business day of the month and assume immediate reinvestment of distributions. ETF results are net of management fees and costs, but before brokerage fees or bid/ask spreads incurred when investors buy/sell on the ASX. Returns for periods longer than one year are annualised.
1QSML Index results are net of QSML’s 0.59% p.a. management fee, calculated daily but do not include brokerage costs or buy/sell spreads of investing in QSML. You cannot invest in an index. QSML’s Index base date is 30 November 1998. QSML Index performance prior to its launch in February 2021 is simulated based on the current index methodology.
2QSML inception date is 8 March 2021 and a copy of the factsheet is here.
3The MSCI World ex Australia Small Cap Index (Parent Index) is shown for comparison purposes as it is the widely recognised benchmark used to measure the performance of developed market small companies, weighted by market cap. QSML Index measures the performance of 150 companies selected from the Parent Index based on MSCI quality scores. Consequently, the QSML Index has fewer companies and different country and industry allocations than the Parent Index. ‘Click here for more details’.
QSML vs International Small Cap Index - Style
When looking at portfolios it is important to determine what style, e.g. value or growth and what size bias a portfolio holds, e.g. giant, large, mid or small. Below we can see QSML’s. Importantly QSML skews towards mid-sized companies and it has a greater growth bias than the International Small Cap Index.
Chart 5: QSML holdings based style map
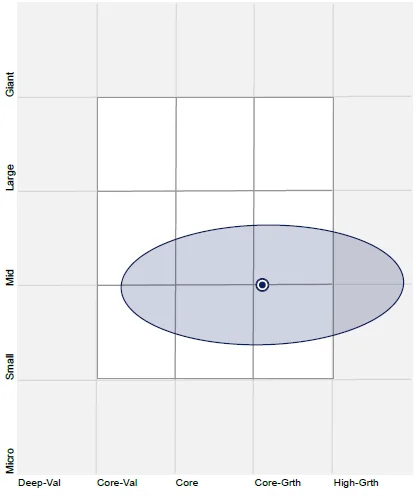
Chart 6: International Small Cap Index holdings based style map
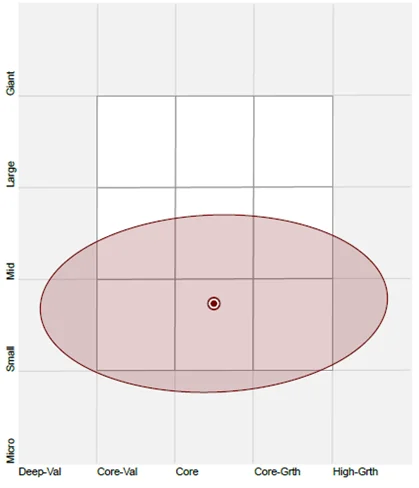
Source: Morningstar Direct, as at 30 June 2024
While each International Small Company approach has its merit for portfolio inclusion, you should assess all the risks and consider your investment objectives.
Arian Neiron is CEO and Managing Director - Asia Pacific at VanEck, a sponsor of Firstlinks. This is general information only and does not take into account any person’s financial objectives, situation or needs. Investors should do their research and talk to a financial adviser about which products best suit their individual needs and investment objectives.
For more articles and papers from VanEck, click here.