Register For Our Mailing List

Register to receive our free weekly newsletter including editorials.

Home / 168

SMSF asset allocation changes unexpected

There has always been considerable misinformation surrounding the asset allocation of SMSFs. The main reason is the inadequate categorisation and long-time lags in the ‘official’ Australian Taxation Office (ATO) statistics. Cuffelinks has discussed this directly with the ATO, as reported in previous articles here and here.

The main shortcoming is that the category ‘Overseas shares’ only includes direct share investments, and excludes the billions invested through listed and unlisted trusts and other managed investments. When I confronted the ATO on overseas share asset allocation, their response was:

“It’s fair to say a substantial amount is in international equities, much larger than the number quoted under the ‘Overseas shares’ category.”

According to the official statistic, less than 1% of SMSF assets resides in ‘Overseas shares’. Considering that SMSFs hold one-third of our $2 trillion in superannuation assets, this inaccuracy is a major shortcoming. In fact, people marketing global funds often take advantage of this low number, imploring trustees to correct their ridiculous asset allocation mistake and invest in their global fund. The truth is, trustees are already using hundreds of other available global channels.

A more accurate SMSF asset allocation number

SuperConcepts has released its 2016 Financial Year Analysis based on the actual investments of about 3,300 SMSFs administered by its subsidiary Multiport. Due to its relationship with AMP, this group has more financial adviser input than the average SMSF, giving a greater allocation to managed funds and global equities, but it is instructive of SMSF trends nonetheless.

Asset allocation of sample SMSFs as at 30 June 2016

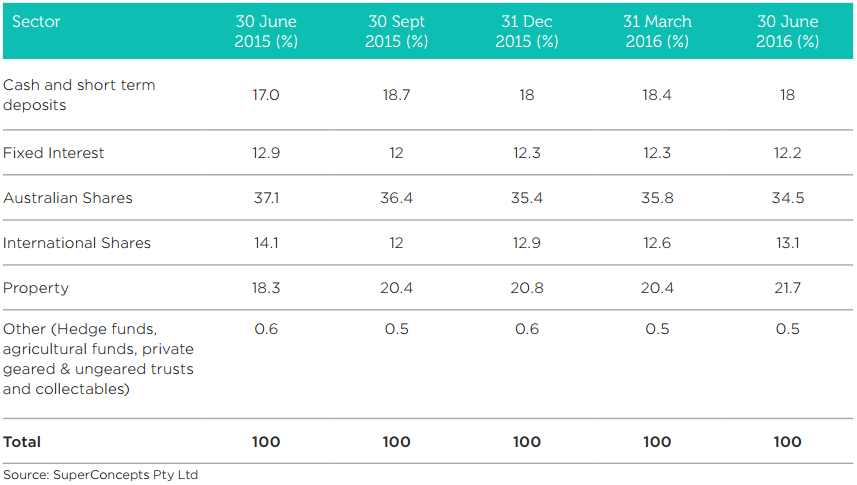
The interesting and sometimes unexpected changes in the last year include:

  • A fall in equity investments, with domestic down from 37.1% to 34.5%, and international down from 14.1% to 13.1%, refuting the claims about the TINA (There Is No Alternative to equities) mentality in the sector. SuperConcepts attributes this fall to trustees reducing their exposure during periods of higher volatility, and less appeal of the local large cap stocks. Among the most commonly held investments, two pooled structures, Magellan and Platinum, are favourites with this group for global exposure.
    Over the course of 2015/2016, the amount held in the top 10 listed securities fell from 16.5% of all investments to 14%. The Top 10 shares by market cap still represent about 38% of Australian equities held by SMSFs, but the reduction recognises that investors are more concerned about the capital growth of the banks, BHP, Newcrest, and Telstra. Increasingly, SMSFs are looking for opportunities outside of the large caps.
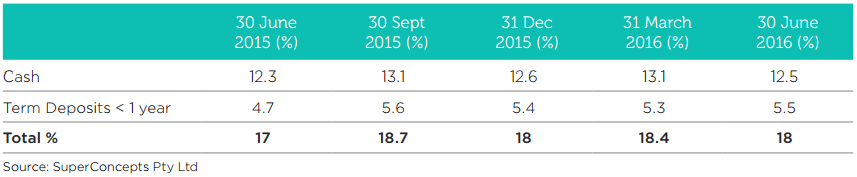
  • Cash holdings have increased from 17% to 18% despite low interest rates. Within this segment, term deposits rose more strongly than at-call cash, which took a hit in the last quarter in the face of falling cash rates. It’s surprising to see the large allocation in this segment.

Cash-holdings-of-sample-SMSFs-30-June-2016

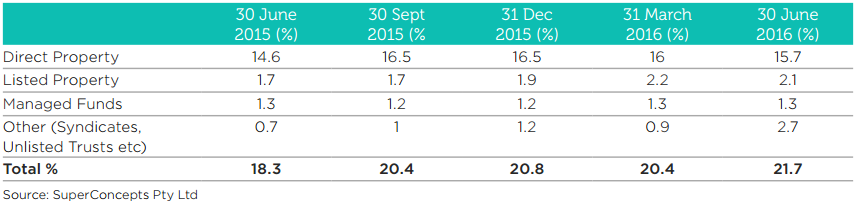
  • Property has been the big winner, up from 18.3% to 21.7%, including both listed and unlisted segments. Direct property (often business premises held by the SMSF and rented to one of the trustees, rather than residential property) rose steadily, but the major increase came in the ‘other’ category of syndicates and unlisted trusts. With listed A-REITS trading at a hefty premium to NTA, unlisted trusts have benefitted from the search for yield at better prices.

Property-holdings-of-sample-SMSFs-30-June-2016

  • Fixed interest allocations fell overall, but hybrids and direct holdings rose. Managed funds in this segment comprise only 4.4% of assets, losing out badly to cash.

(The full report also looks at market movements versus funds flow and makes the same conclusions regarding increases in cash and property and reductions in fixed interest and equities).

Trustees take cash flow decisions in the final quarter

Both inflows and outflows from SMSFs are always at their highest in the June quarter as trustees take action before the end of the financial year. However, with uncertainty surrounding the May 2016 budget, average inflows to SMSFs in the June 2016 quarter of $10,700 were the lowest since 2012. June withdrawals are also heavy, at $17,800, as trustees ensure they meet minimum pension requirements. Withdrawals are always heavier than contributions in any quarter, showing how much the continuing growth of SMSF balances relies on market performance.

Checking from another source

We checked these numbers against the Vanguard/Investment Trends March 2016 SMSF Investor Report, based on a survey of 3,531 SMSF trustees. Its major findings are consistent in direction and include:

  • Direct shares (outside of managed funds and ETFs): 38% of total SMSF assets in 2016, down from 41% in 2015
  • Cash and other cash products: 25%, up slightly from 24% in 2015
  • ETFs: now at 3%, up from 2% in 2015
  • Managed funds: 10%, up from 9%
  • Direct property (residential & commercial): 11%, up from 10%
  • Other investments: 13%, steady

Investment Trends believes the allocation to direct shares (outside of managed funds and ETFs) has declined over the past three years as a result of market performance and poor investor sentiment towards individual shares.

Marketing opportunities

These SMSF investment patterns suggest there are good opportunities for bond funds and other cash alternatives, ex-20 Australian equity funds and other global equity funds. Property is popular but managed funds miss out to direct property, unlisted and syndicates.


Graham Hand is Editor of Cuffelinks. See the full Investment Patterns Survey here. SuperConcepts is a Cuffelinks sponsor.


5 Comments
Rob
August 17, 2016

Ha!
SHL, VOC, SLK, NAN, RMD (all now sold), ASX, WAX, CAR, SEK, MQG, VRT and some others (all still held).
No other banks, resources or TLS.
Cheers

Billy
August 16, 2016

So Rob, you know what the next question is!

Rob
August 14, 2016

I should have clarified, the 60% allocation to ASX was not simply via index, but in selected individual stocks, so yes it was stock picking per se, but nevertheless was still also a 60% allocation to ASX shares, so both statements are correct.
The return is audited, post contribution, after costs/tax credited return to member statements.
Cheers

SMSF Trustee
August 12, 2016

With respect Rob that allocation could not have returned anything like 15%.
None of those three asset classes delivered anything like that, not even double digits.

Maybe it was the individual shares you had. Some did well, like ASX or Wesfarmers or many small caps. But that is stock selection not asset allocation that got you that return.

How did you calculate that return? I have seen many people over the years claim to have got a great return and ridiculed fund managers, but when I've gone through how they calculated it, they had simply not done it properly. Not saying you haven't, but it's easy to make a claim like that without any evidence. And as I said, your asset allocation could not have given you that return in 2015-16, it's not mathematically possible.

Rob
August 11, 2016

Thanks Graham,
My own SMSF allocations have not changed in the past 12 months with approx. 15% cash, 25% overseas equities (via LICs) and 60% domestic equities. This allocation returned ~15% in FY16.
Cheers
Rob


Leave a Comment:

RELATED ARTICLES

SMSFs and COVID: the biggest trends in 5 charts

What is happening with SMSFs? Part 2

Six advantages of an SMSF

banner

Most viewed in recent weeks

2024/25 super thresholds – key changes and implications

The ATO has released all the superannuation rates and thresholds that will apply from 1 July 2024. Here's what’s changing and what’s not, and some key considerations and opportunities in the lead up to 30 June and beyond.

Five months on from cancer diagnosis

Life has radically shifted with my brain cancer, and I don’t know if it will ever be the same again. After decades of writing and a dozen years with Firstlinks, I still want to contribute, but exactly how and when I do that is unclear.

Uncomfortable truths: The real cost of living in retirement

How useful are the retirement savings and spending targets put out by various groups such as ASFA? Not very, and it's reducing the ability of ordinary retirees to fully understand their retirement income options.

Is Australia ready for its population growth over the next decade?

Australia will have 3.7 million more people in a decade's time, though the growth won't be evenly distributed. Over 85s will see the fastest growth, while the number of younger people will barely rise. 

Why LICs may be close to bottoming

Investor disgust, consolidation, de-listings, price discounts, activist investors entering - it’s what typically happens at business cycle troughs, and it’s happening to LICs now. That may present a potential opportunity.

The public servants demanding $3m super tax exemption

The $3 million super tax will capture retired, and soon to retire, public servants and politicians who are members of defined benefit superannuation schemes. Lobbying efforts for exemptions to the tax are intensifying.

Latest Updates

Shares

Exploiting Warren Buffett

Growth investors are using Buffett to justify buying blue chip stocks at almost any price. It’s a recipe for potential disaster, as investors in market darlings like CBA and Cochlear may be about to find out.

Property

Population density trends and what they mean for housing

With Australia’s population moving through the fastest rate of growth since the 1950s, our cities and towns are naturally densifying. This is a look at the latest trends and how they will impact the property market.

SMSF strategies

The ultimate superannuation EOFY checklist 2024

We're nearing the end of the financial year and it's time for SMSFs and other super funds to make the most of the strategies available to them. Here's a 24-point checklist of the most important issues to address.

Shares

The outlook for Nvidia, from a long-time investor

Nvidia has taken the world by storm and is now the third largest stock on the planet - larger than Meta, Amazon, and Alphabet. Here is the latest take on Nvidia from a fund manager who first invested in the company in 2016.

Economy

Gross National Happiness?

Despite being richer, surveyed measures of happiness have been flat to falling in Australia. Some suggest we should focus less on GDP and more on broader measures of wellbeing, though there are pros and cons to that approach.

Shares

The power of dividends

In an era where growth companies dominate and the likes of Nvidia grab all of the attention, dividend paying stocks are flying under the radar. Some of these stocks offer compelling prospective returns.

Fixed interest

The best opportunities in fixed income right now

After more than a decade of pitiful yields, bonds are back offering better prospects for income investors. What are the best ways to take advantage of the market inefficiencies in Australian fixed income?

Sponsors

Alliances

© 2024 Morningstar, Inc. All rights reserved.

Disclaimer
The data, research and opinions provided here are for information purposes; are not an offer to buy or sell a security; and are not warranted to be correct, complete or accurate. Morningstar, its affiliates, and third-party content providers are not responsible for any investment decisions, damages or losses resulting from, or related to, the data and analyses or their use. To the extent any content is general advice, it has been prepared for clients of Morningstar Australasia Pty Ltd (ABN: 95 090 665 544, AFSL: 240892), without reference to your financial objectives, situation or needs. For more information refer to our Financial Services Guide. You should consider the advice in light of these matters and if applicable, the relevant Product Disclosure Statement before making any decision to invest. Past performance does not necessarily indicate a financial product’s future performance. To obtain advice tailored to your situation, contact a professional financial adviser. Articles are current as at date of publication.
This website contains information and opinions provided by third parties. Inclusion of this information does not necessarily represent Morningstar’s positions, strategies or opinions and should not be considered an endorsement by Morningstar.