Stock market prices are like email: they’re distraction machines. With email, it often distracts people from getting work done efficiently. With stock prices, they distract investors from what really matters: the businesses underlying them.
Ralph Wanger, a legendary US small cap fund manager, knew this well. Wanger ran the Acorn Fund from 1970 to 2003, clocking 16.3% annual returns compared to the S&P 500’s 12.1%. He used the following analogy to describe the behaviour of a typical investor:
“There’s an excitable dog on a very long leash in New York City, darting randomly in every direction. The dog’s owner is walking from Columbus Circle, through Central Park, to the Metropolitan Museum.
"At any one moment, there is no predicting which way the pooch will lurch. But in the long run, you know he’s heading northeast at an average speed of three miles per hour.
"What is astonishing is that almost all of the dog watchers, big and small, seem to have their eye on the dog, and not the owner.”
Wanger’s point is that investors are transfixed by stock prices (the dog), when they should focus on businesses (the dog owner).
Put another way, the performance of a business will be ultimately reflected in its stock price.
100 baggers
What parts of a business’ performance should be tracked?
Thomas Phelps, a US-based financial analyst and advisor, had some answers. Phelps wrote a well-known book called ‘100 to 1 in the Stock Market’ in 1972. It was about his quest to find stocks that could increase by 100x.
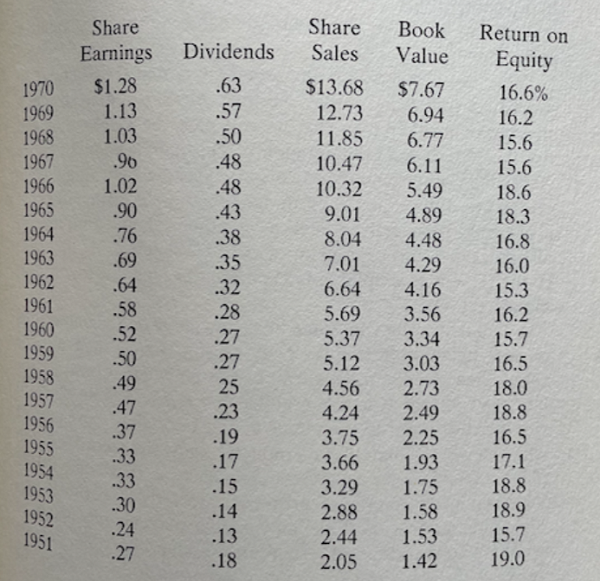
In the book, Phelps created a table of basic financials for Pfizer over a 20-year period.
Simple stuff.
Phelps then went on to ask: “Would a businessman seeing only those figures have been jumping in and out of the stock?” His conclusion: “I doubt it.”
True enough. The table shows Pfizer sales went up 6.7x over 20 years, earnings increased 4.7x, dividends climbed 3.5x and return on shareholder funds was consistently high, averaging close to 17%.
If you’d focused on Pfizer’s price, you may not have hung on to the stock. The stock had highs and lows, and significantly underperformed the market over a five-year stretch during that period.
And because so many people have been “sold on the nonsensical idea of measuring performance quarter by quarter - or even year by year - many would hit the ceiling if an investment advisor failed to get rid of a stock that acted badly for more than a year or two.”
Bailing on Pfizer would have been costly. The stock went up 25x excluding dividends over the 20 years.
Phelps issued a challenge to his readers:
“The secret of success in your quest for 100-to-one stocks is to focus on earnings power rather than prices. Can you do it?”
Similar strategies
Several current fund managers use similar metrics to Phelps to track business performance.
Warren Buffett’s business partner, Charlie Munger, zeros in on a business’ return on capital to determine whether it can deliver satisfactory returns:
"Over the long term, it's hard for a stock to earn a much better return than the business which underlies it earns. If the business earns 6% on capital over 40 years and you hold it for that 40 years, you're not going to make much different than a 6% return—even if you originally buy it at a huge discount. Conversely, if a business earns 18% on capital over 20 or 30 years, even if you pay an expensive looking price, you'll end up with a fine result."
Francois Rochon, a Canadian-based global fund manager, uses a comparable table to Phelps to explain his investment philosophy.
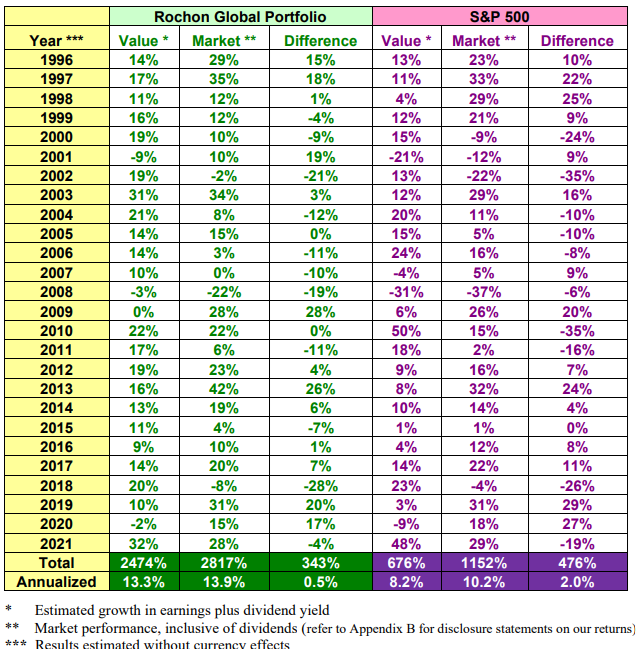
The first thing to note is that Rochon has crushed the market over the long period. He’s done it by focusing on companies that can deliver +15% EPS growth over the long term. In the table, he measures the value of his portfolio by calculating the EPS growth plus dividend yield of his fund holdings each year. The 13.3% annualized return is close to his target of 15%.
Compare that to the S&P 500, which has delivered 8.2% annualized growth in value, as measured by annual EPS growth plus dividend yield.
Rochon’s theory is that the EPS growth plus dividend yield will eventually be reflected in stock prices. And the table demonstrates that he is largely correct.
Terry Smith, a UK-based manager of the highly successful Fundsmith, provides a more sophisticated table of his global fund’s key metrics:
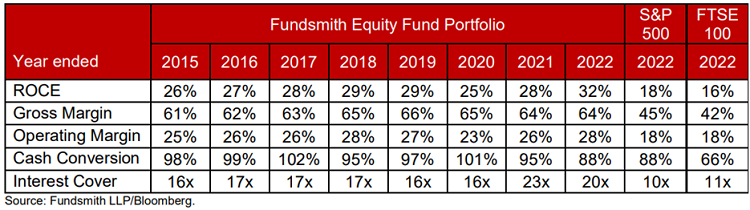
From the table, you can see that Smith is a growth investor who likes businesses with high returns on capital employed (it’s like ROE but includes debt in the calculation), high margins, ones that converts profits into cashflow (a check on whether there’s any funny accounting involved) and have high interest cover (ensuring earnings before interest and tax can comfortably cover interest expenses).
If you compare Smith’s metrics to the S&P 500, you’ll notice that the businesses in his fund have much higher ROCEs, margins, and interest cover, with identical cash conversion rates.
Smith thinks that if he owns businesses with superior fundamentals as outlined in this table, and he buys them at a multiple similar to the market, then he should deliver market-beating returns. And he’s been proven right with his long-term track record.
The Morningstar point of view
Morningstar analysts focus on identifying moats or sustainable competitive advantages. While the assessment may be qualitative in nature the financial statements will reflect the impact of the sustainable competitive advantage. A company with a moat will have a return on invested capital (“ROIC”) that exceeds the weighted average cost of capital (“WACC”). In layman’s terms this means the company will be able to generate a return by investing in the business that exceeds the cost it takes to raise capital. If a company can raise capital at 7% and earn a 10% return the difference will accrue to investors over time.
Buffett’s take
Like so many things in investing, the final word on the topic should go to Warren Buffett:
“Games are won by players who focus on the playing field – not by those whose eyes are glued to the scoreboard. If you can enjoy Saturdays and Sundays without looking at stock prices, give it a try on weekdays.”
James Gruber is an Assistant Editor at Firstlinks and Morningstar.