It's clear looking through history that markets have fashions. Every economic cycle has its distinctive characteristics in which different sectors take up leadership
As we’ve stated previously:
“In the second half of the late 1990s, the market was TMT led; in the noughties (post 2000 – 2002 bear market) the market was led higher by energy, materials and banks; post GFC bust, the defensive sectors initially led the market through to 2015 (healthcare, consumer staples as well as consumer discretionary); while finally in recent years, it’s been IT and growth stocks.”
Source: ‘Markets have Fashions’, LV on Friday, 8th Jan 2022
Figure 1: S&P500 sector leadership (% performance of leading sectors)
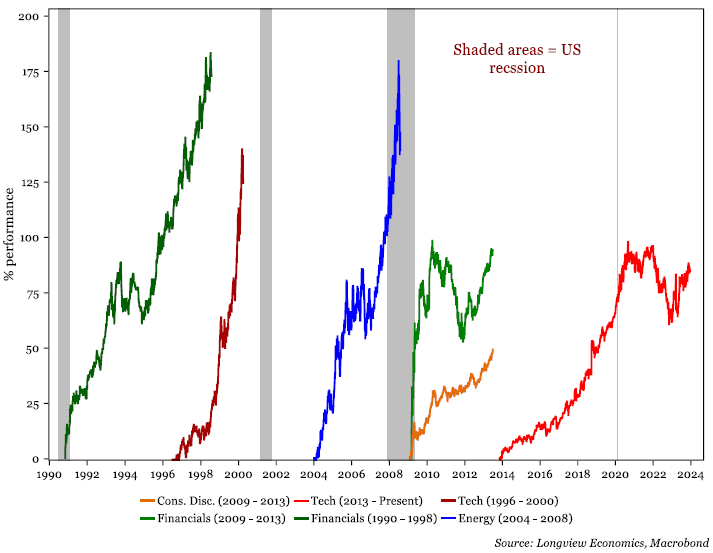
Tech has led equities higher since 2014, as highlighted in figure 1 above. But, with ‘fashions’ usually only lasting between 5 – 8 years, the key question is: For how long will the current fashion continue? Are we about to see another major shift in sector leadership?
Usually, fashions change when (i) a new macro theme emerges; and (ii) valuation discrepancies become extreme.
With respect to (ii), from a valuation perspective, three factors currently point to a forthcoming switch in leadership. All of which draw strong parallels between the current cycle and the 2000s dotcom bubble. In particular:
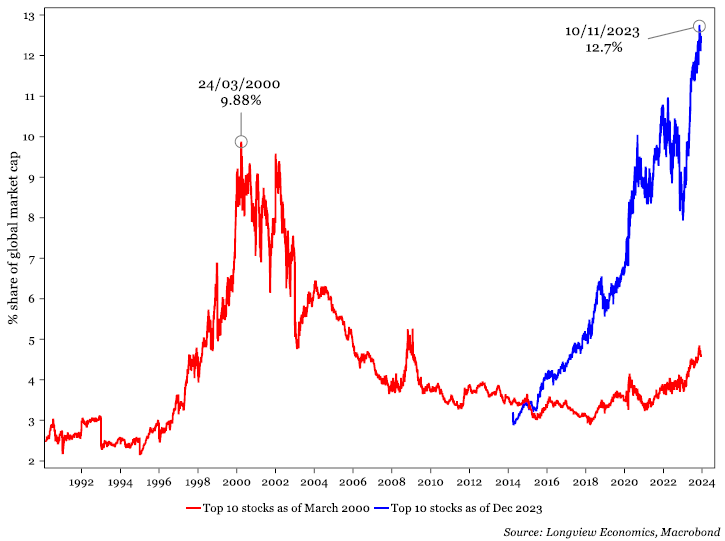
1. Both periods were dominated by tech sector outperformance, with tech stocks making up a significant share of global market cap (both then and now). Today’s mega cap stocks, though, make up a larger share of the global market share than they did in the dotcom bubble. In the early 2000s1, the top 10 stocks made up 9.9% of the global market cap (at their peak). Today, they make up 12.7%2 (figure 2). In other words, the breadth of market leadership is narrower today than during the dotcom bubble (on that measure). On that basis, therefore, tech sector dominance has become overstretched, which is typical ahead of market leadership switches.
Figure 2: Top 10 stocks (2000 & 2023) as a share of global market cap (%)
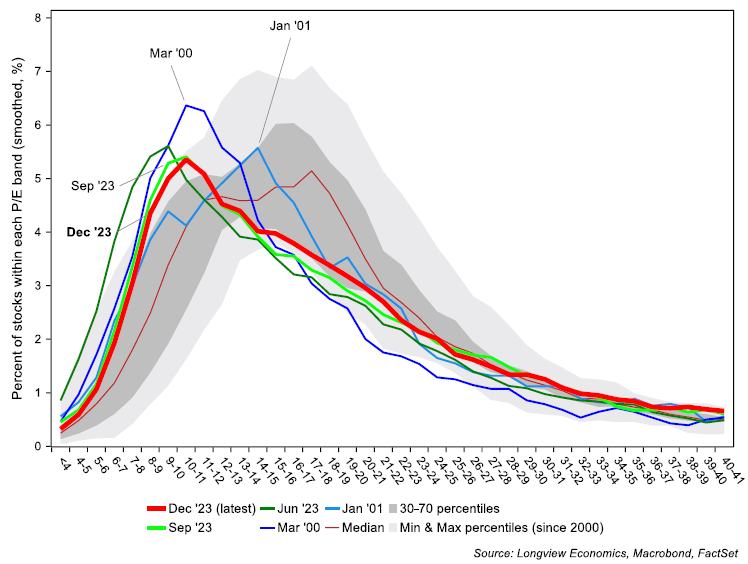
2. The distribution of single-stock price-to-earnings (PERs) model remains heavily skewed to the left (figure 3) as it was in early 2000. While the distribution has shifted somewhat to the right since our last update in September, it remains skewed to the left compared to the historic median. The distribution remains similar to the 2000s tech bubble. This chart below is therefore another way of showing that America’s rich valuation is driven by a small number of mega-cap stocks (while most other stocks within the S&P500 remain cheap relative to history). Indeed, further supporting that, small cap equity indices are at 20-year low valuations relative to the S&P500.
Figure 3: Distribution of individual underlying single stock PERs (US market)
3. Other key models point to a major shift in market leadership in coming months/quarters. The Longview proprietary valuation model, for example, is now generating its first strong SELL message since the bursting of the dotcom bubble in early 2000 (figure 4). Historically, this model has generated timely SELL/strong SELL signals ahead of many key market downturns/bear markets, including ahead of the 2000-02 and 2007-09 bear markets, as well as the 1987 crash and the early 1980s recession (i.e. major turning points in sector leadership). That further highlights the expensiveness of the US (which is dominated by tech stocks).
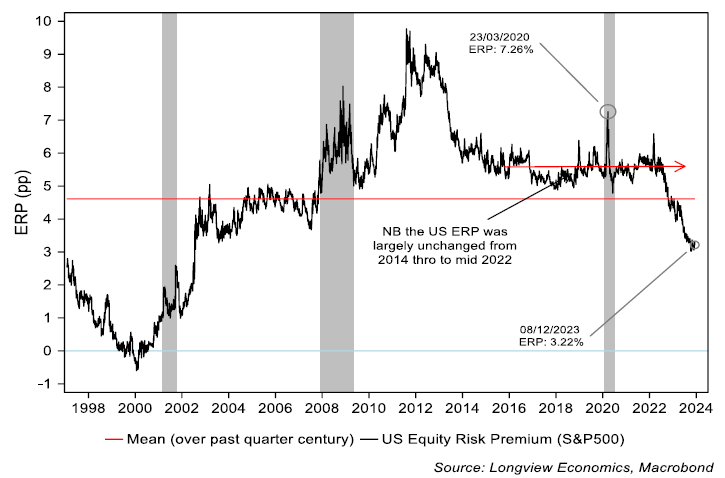
Consistent with that, various US equity risk premium models have fallen sharply and are back at levels of the early 2000s (i.e. signalling that equities are expensive relative to real bond yields/cash rates.
Overall, therefore, a change in market leadership seems likely in coming months and quarters. The question is: Which sectors, and therefore which country indices are likely to take up that leadership?
Figure 4: Longview proprietary valuation model vs. S&P500 (log scale)
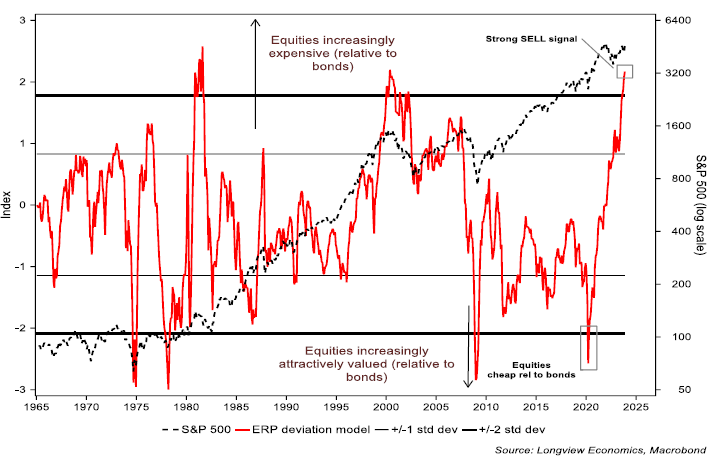
Figure 5: US equity risk premium (earnings yield less real bond rate)
Relative Sector Valuations
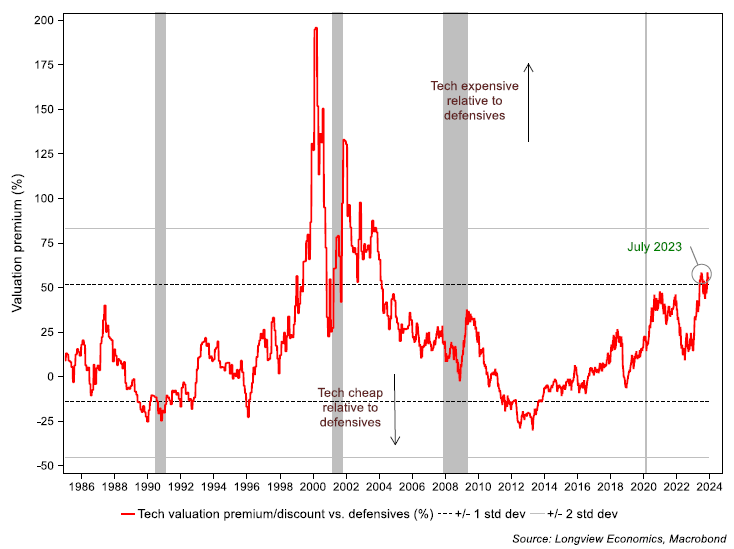
As highlighted above, tech valuations are notably high on a standalone basis. Tech/growth stocks are also, though, over-stretched relative to other sectors and equity indices, from a valuation perspective.
In a general sense, for example, the valuation premium of US growth stocks relative to an (equally weighted) basket of (i) defensive; and (ii) cyclical sectors has become extreme (e.g. see figure 6 below). Equally, compared to both US and global equity indices, Tech’s valuation premium recently reached a +1 standard deviation.
Figure 6: US tech valuation premium/discount relative to defensives (%)
The key question, therefore, becomes: Which sectors are attractive? Which sectors could become the next ‘fashion’?
Energy, in particular, is the cheapest relative to other US sectors. As shown in the US sector heatmap below (figure 7), energy PERs are in their second percentile relative to history (vs. the S&P500 index). Indeed, energy is now trading at a deeper valuation discount than at the 2001 or 2008 lows (figure 8 below).
Figure 7: US sector PE heatmap
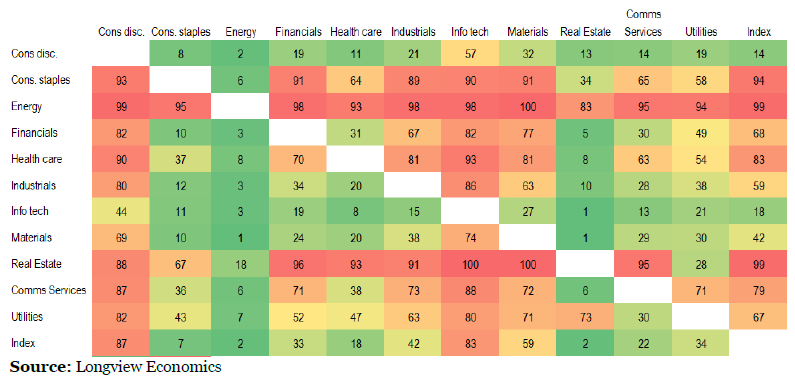
Fig 8: US energy valuation premium/discount relative to the S&P500 (%)
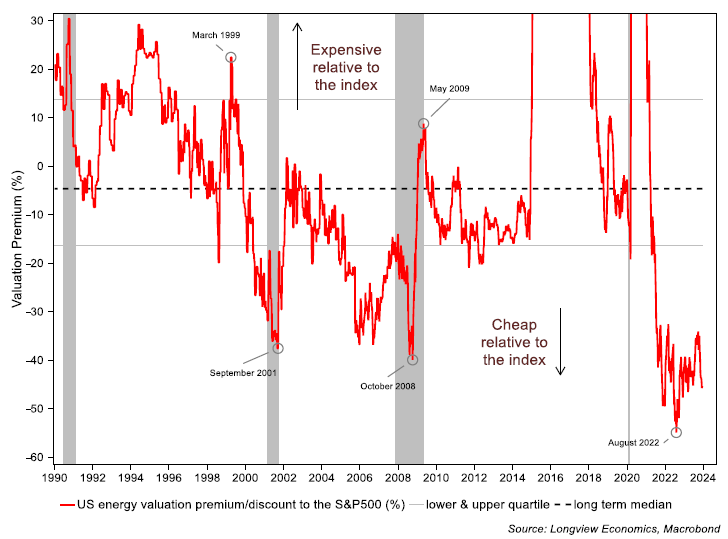
When compared to tech, the energy sector is at its lowest relative valuation since the early 2000s. Added to which, from a fundamental perspective, there’s a strong case for higher energy prices and, more broadly, a commodity supercycle. Historically, chronic underinvestment in supply results in a prolonged period of high commodity prices. That has been the case this past decade and supports the expectation that energy will become the new ‘fashion’. That, if it happened, would draw another parallel with the dotcom bubble (i.e. with energy taking up leadership in the early 2000s, see figure 1).
From a global perspective, energy, consumer staples and financials are the cheapest sectors relative to the others.
Relative Valuations (by Geography)
Consistent with extreme tech valuations (vs. other sectors), US equities are overstretched relative to other major global equity markets. The US is now the fourth most expensive market we track (relative to forty-two other major country stock markets). It is the second most expensive on a country-by-country relative PE basis (currently in its 83rd percentile on average, just behind India which is in its 90th percentile).
Consistent with that, Europe is extremely cheap. European forward PEs have reached their lowest level since 1992 (relative to the global PER). Within Europe, Spanish equities remain attractive. Italy, similarly, is also cheap on a relative valuation basis (e.g. relative to the US, and other European indices), while the UK is close to record cheap levels versus the rest of the world.
Elsewhere, emerging markets broadly remain mid-range on a relative PER basis. Within that, though, several countries/regions are relatively cheap. Most notably, China’s PER has sunk to its 16th percentile when compared to the global PER. In contrast, India is now the most expensive market we track (now in its 90th percentile on average relative to other major economies).
1 In 2000, the top 10 stocks by market cap were: General Electric, Microsoft, Cisco, Texas Instruments, Exxon Mobil, Procter & Gamble, Walmart, Oracle, IBM, Citigroup.
2 In 2023, the top 10 stocks by market cap were: Apple, Microsoft, Amazon, Google, Nvidia, Tesla, Berkshire Hathaway, Meta, Eli Lilly, Broadcom.
Bradley Waddington is an Economics and Markets Analyst at Longview Economics. This article is an extract from Longview's quarterly global asset allocation report and has been reproduced with permission.