The Weekend Edition includes a market update plus Morningstar adds links to two additional articles.
We hear a lot about our cost of living crisis but how do prices in Australia compare to the rest of the world? Deutsche Bank has released a new report, Mapping the World’s Prices, that compares the prices of everyday things such as rent, phones, coffee, taxis, and more across 69 of the largest cities. Fair warning that of Australian cities, only Sydney and Melbourne are included.
Purchasing power parity
A common way to compare costs between countries is by measuring purchasing power parity (PPP). This economic concept suggests that in the long run exchange rates should move towards the rate that would equalise the prices of an identical basket of goods and services in any two countries.
In PPP terms, Australia now ranks fourth in the world, behind Switzerland, Israel, and the US. Australia has become more expensive since the start of the century, when we ranked 18th.
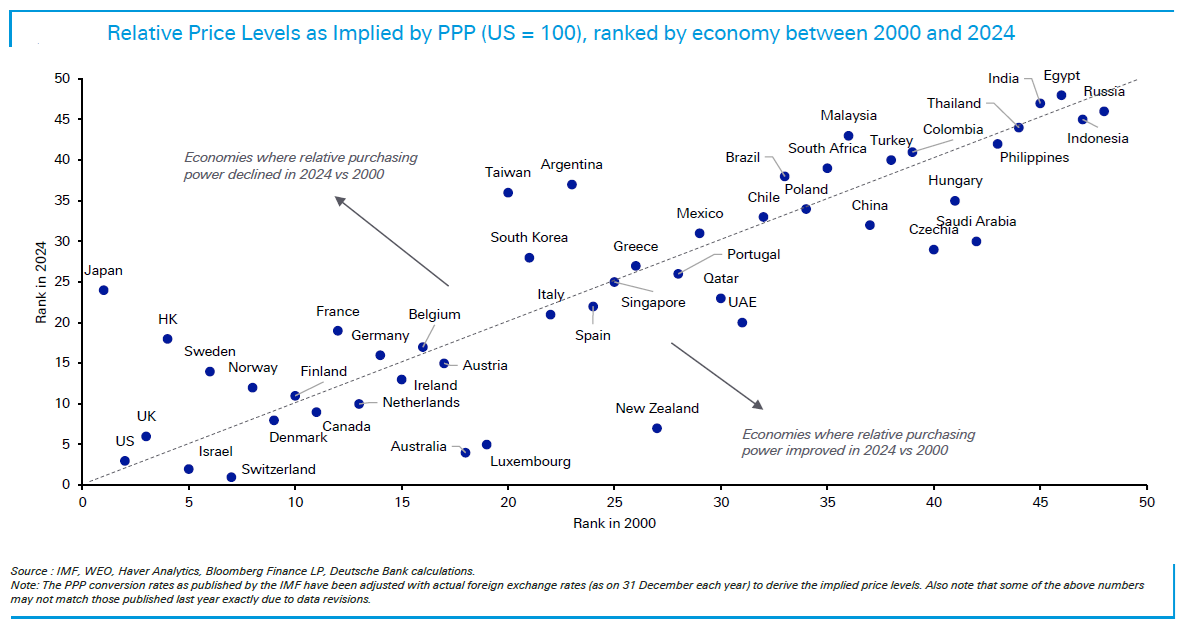
Deutsche asks a pertinent question: why is Switzerland so expensive? The bank believes it’s due to an attractive mix of being home to high-paying industries and having a stable currency as well as one of the lowest inflation rates in the world. That’s allowed it to retain purchasing power and has helped it to attract capital and people.
The fascinating chart below shows that no country has seen inflation average below 2% since Bretton Woods collapsed in 1971, though Switzerland is closest at 2.2%.
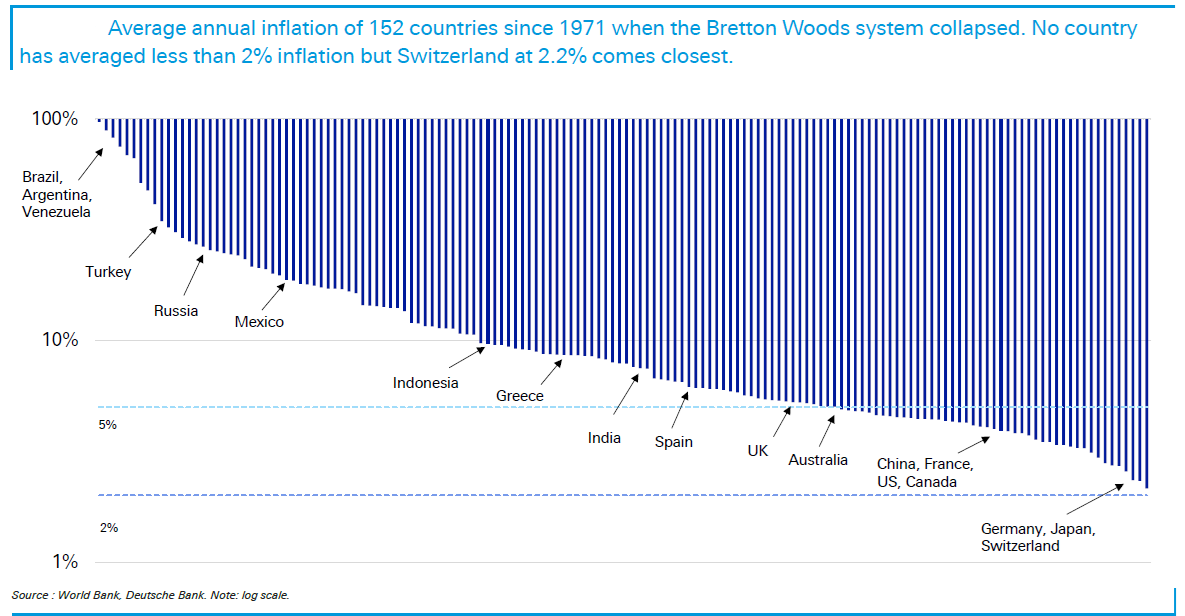
Interestingly, Australia’s inflation has averaged closer to 5% - an inglorious track record.
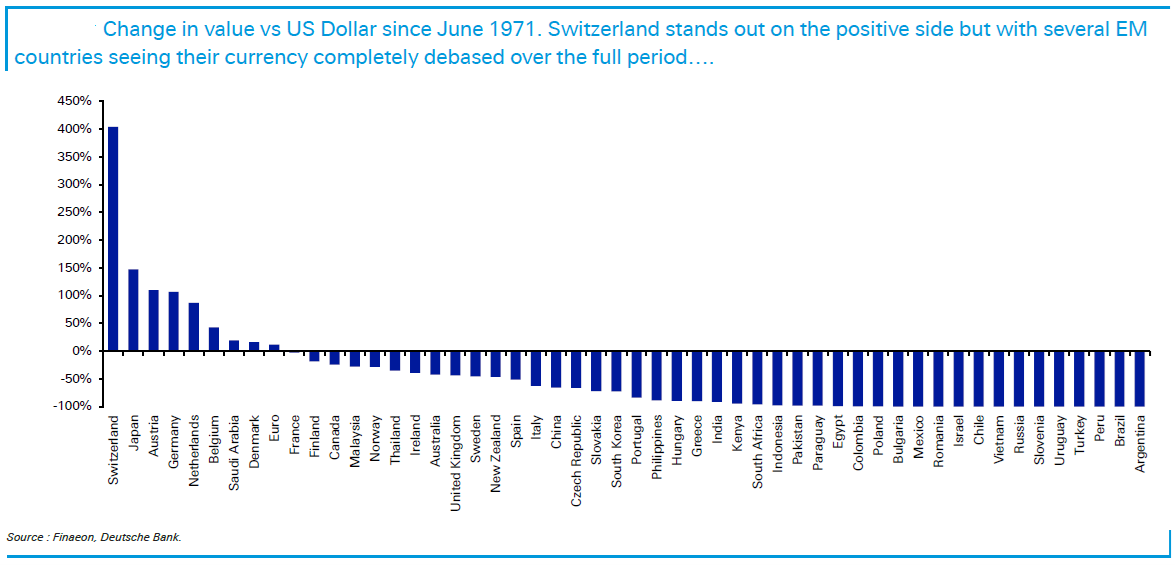
The track record on inflation for different countries broadly correlates to the performance of currencies. Again, Switzerland stands out here.
Prices of everyday items
Deutsche goes on to break down the prices of everyday items across the 69 cities.
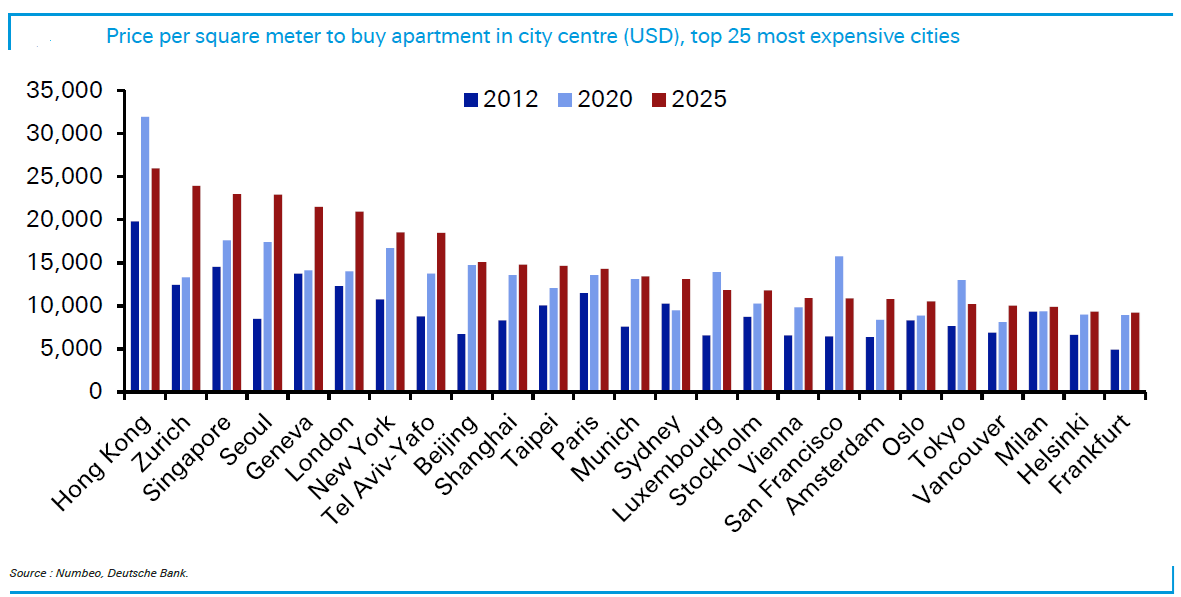
For apartment prices, it will surprise some that Sydney and Melbourne don’t rank in the top 10. The reason is due to the way that Deutsche has measured these prices – it’s taken prices per square metre. On this basis, Sydney comes in 14th place, while Melbourne is 39th.
Hong Kong has the most expensive apartment prices, followed by Zurich and Singapore.
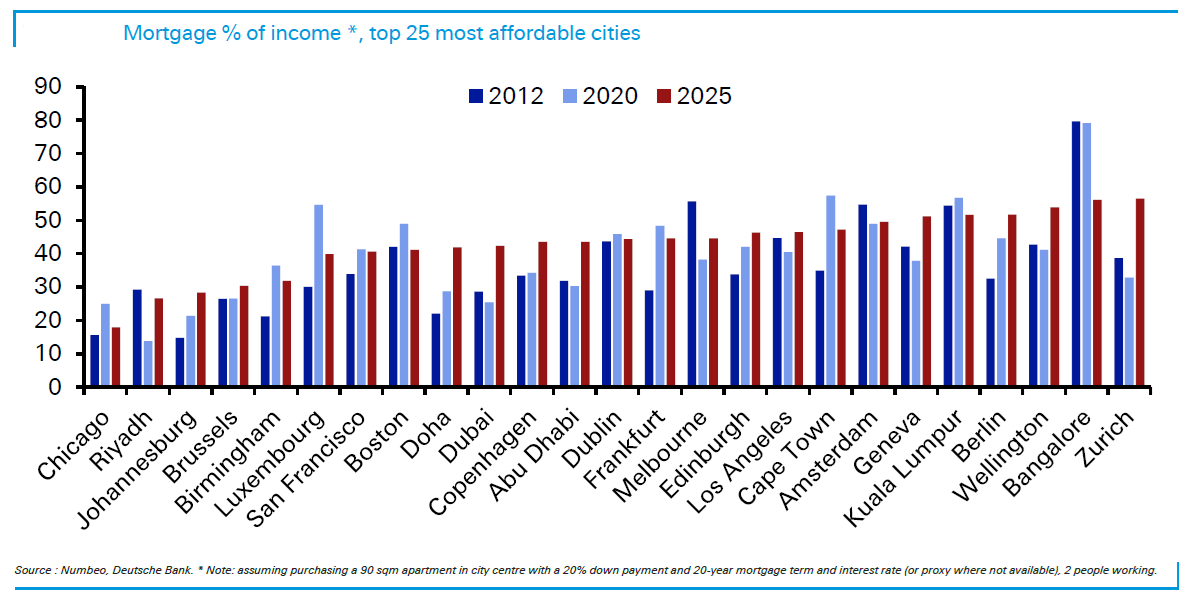
When comparing mortgages to income, we’re not badly off either. Sydney is ranked 30th, while Melbourne is now in the top 25 of the most affordable cities.
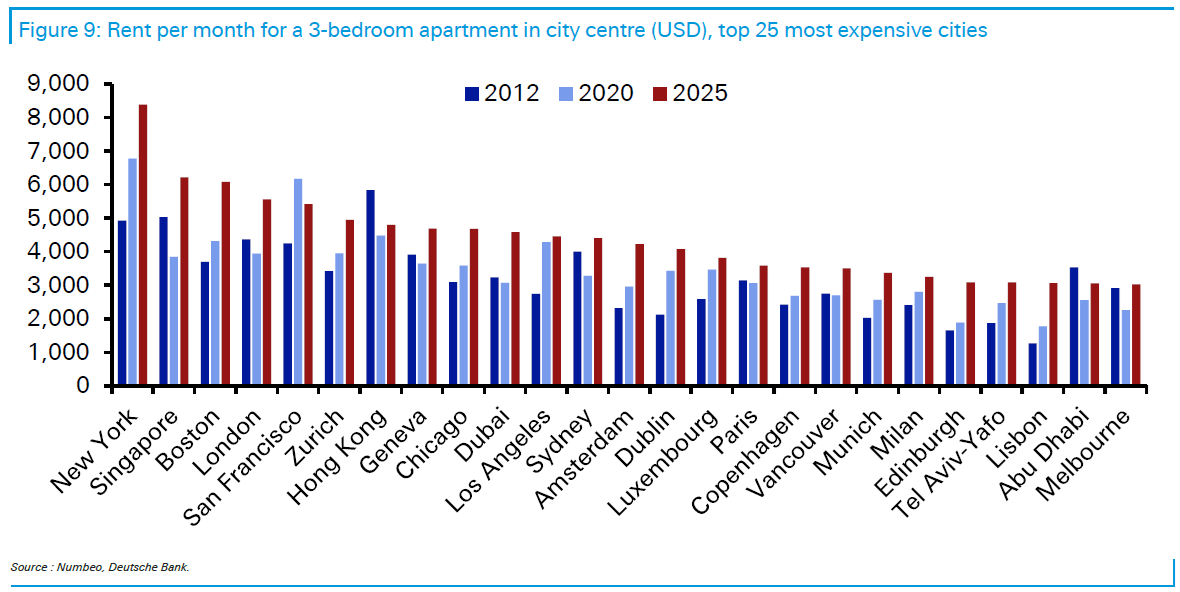
As for rents, Sydney and Melbourne don’t feature in the top 10 most expensive cities, coming in 12th and 25th places respectively.
The most expensive rents are found in New York and Singapore.
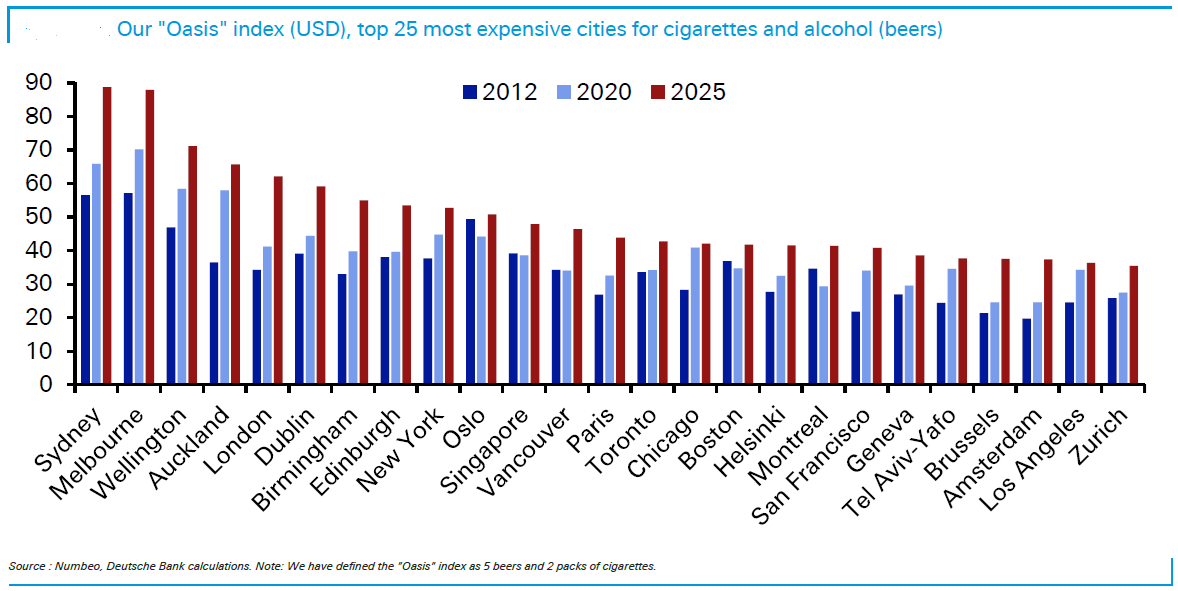
The one category where Australia is a world leader is in costs for cigarettes and alcohol. Sydney and Melbourne are first and second in this category, cheekily dubbed the ‘Oasis index’ by Deutsche.
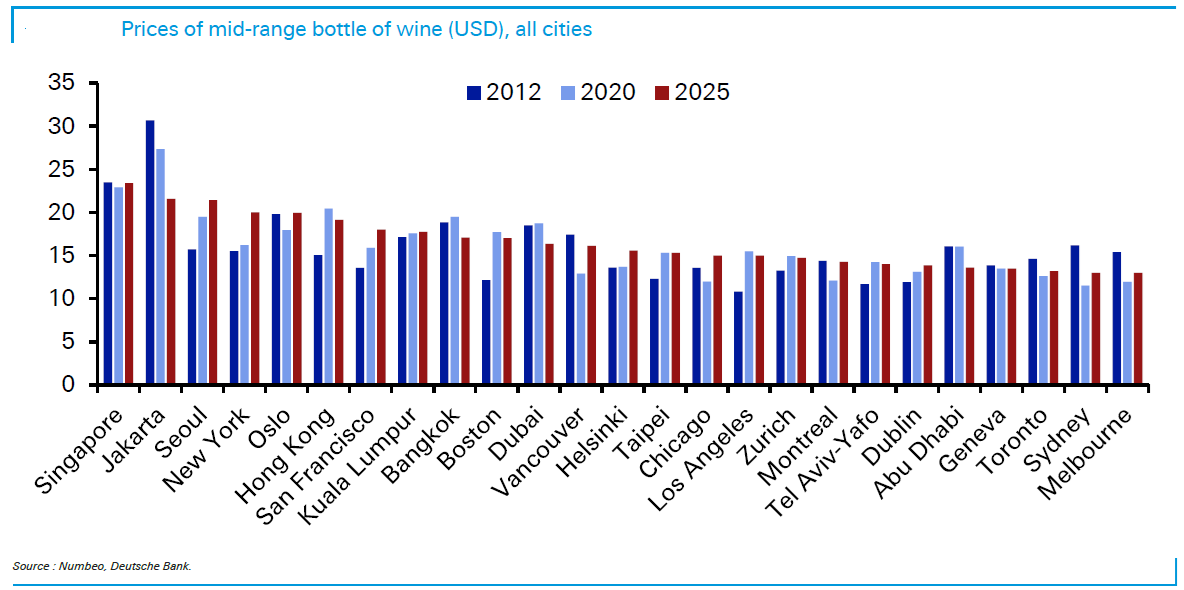
Yet, we’re not that expensive when it comes to prices for mid-range bottles of wine.
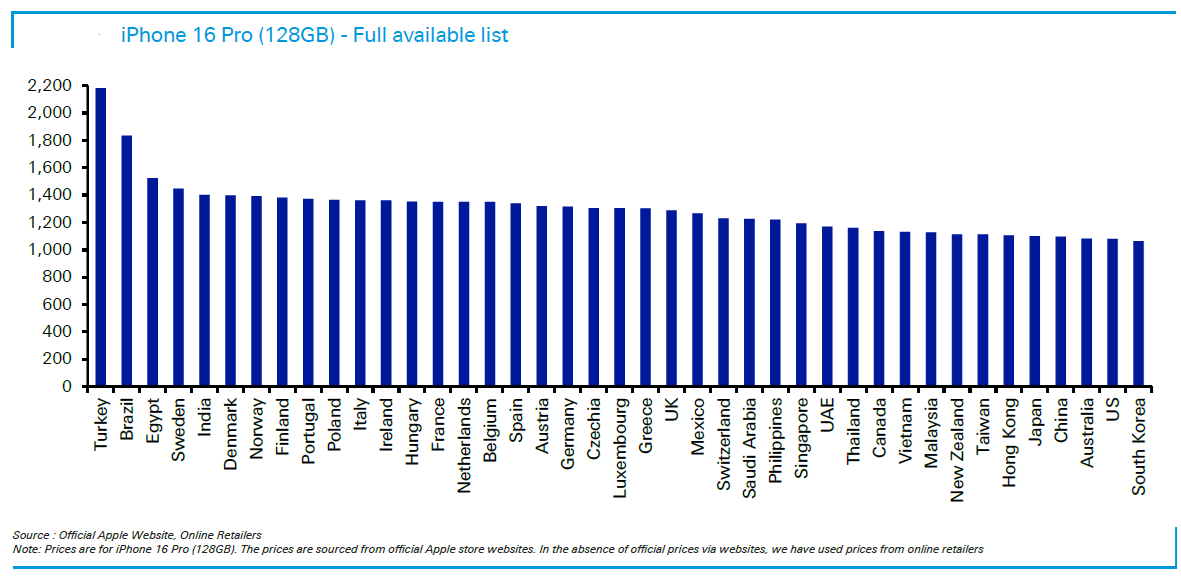
And prices for iPhones here also look reasonable.
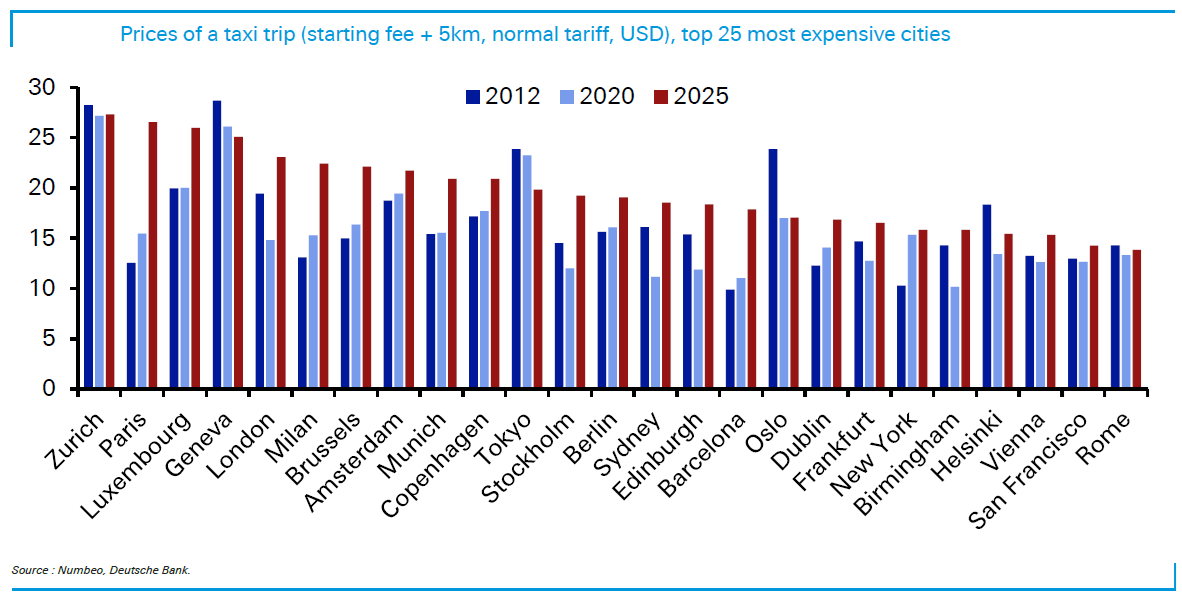
However, taxi prices in Australia are relatively high. Sydney is the 14th most expensive place for taxi trips.
As a general rule, you want to avoid catching taxis in Zurich, Paris, Geneva, and London.
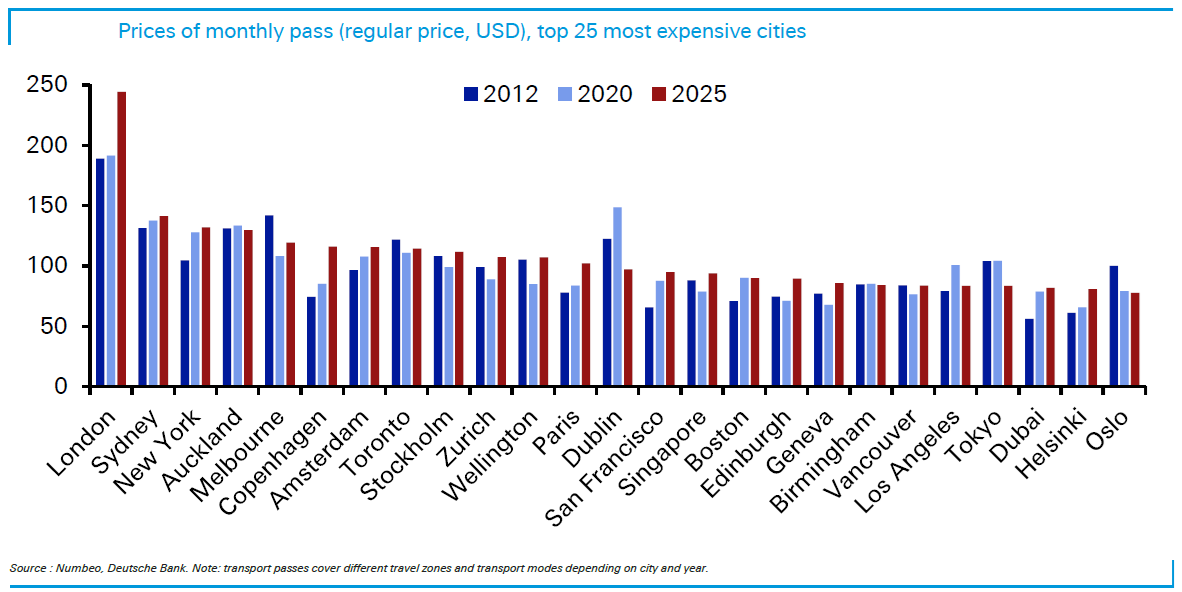
For public transport though, we are pricey, with Sydney ranking 2nd and Melbourne 5th.
What about food? It seems common grievances about grocery prices are valid. Grocery prices in Sydney and Melbourne rank as the 11th and 15th most expensive. On this measure, Geneva, San Francisco, and Zurich lead the way.
And how do we stack up when it comes to cappuccinos? Pretty well, it turns out. Melbourne ranked 40th and Sydney 47th in terms of cappuccino prices.
Quality of life
Deutsche aggregates a lot of this data into an overall quality of life index. It ranks the cities on eight measures, including PPP, safety, health care, cost of living, property prices to income, traffic commute times, pollution, and climate. The bank admits the quality of life index is a “highly subjective measure”.
Nevertheless, on this measure, Melbourne is 9th and Sydney 13th on the list. Melbourne scores strongly on PPP, property prices, pollution and climate, and is let down by traffic commutes and the cost of living. Meanwhile, Sydney scores well on PPP and climate, though poorly on traffic and the cost of living.
According to the report, the top five cities for quality of life are Luxembourg, Copenhagen, Amsterdam, Vienna, and Helsinki.
Intriguing, London and New York are near the bottom, tied in 50th place.
****
In my article this week, the Labor government is conducting numerous reviews into productivity and talking up tax reform as a way to boost our stagnant economy. So it's a good time to take a quick stocktake with seven charts on who pays the taxes, who owns the assets and who earns the income. What do an average 100 Aussies look like?
On the topic of Labor's reviews, Jonathan Rochford also proposes 10 policies to lift our productivity, including introducing a flat income tax rate, reducing migration, and making childcare tax-deductible.
James Gruber
Also in this week's edition...
Shane Oliver is back with an overview of the state of the residential property market. He has seven key charts on what's really driving prices, supply, affordability, and the outlook.
The proposed $3 million super tax has been criticised for the use of unrealised capital gains and the lack of indexation. In effect, it is a complex measure to introduce improved fairness into the superannuation system. However Dr David Knox thinks there's a simple alternative that could fix the issues and achieve the government's goals.
After the meteoric rise in CBA shares, super funds are floating the idea of carving out the weightings of ASX bank securities and indexing them within their portfolios. Andrew Brown ventures back through history to show why this might be a bad move.
As money looks for a home outside the US, Asia may soon get more recognition. In an interview, Fidelity's Anthony Srom outlines the best places in Asia to invest, including in Chinese consumer names, Indian financials, and Thailand.
One of the most misunderstood concepts in finance is the time value of money. Tony Dillon says our overvaluing of the present and underestimating the future costs us dearly when it comes to savings, spending, and loans. He offers some workarounds to avoid common traps.
Two highlights from Morningstar this weekend. Jon Mills updates his views on BHP after their quarterly results, while Matthew Dolgin reports on Netflix's earnings and his views on its outlook.
In this week's whitepaper, the World Gold Council has its mid-year outlook for the yellow metal.
Weekend market update
In the US on Friday, stocks rose once more to the tune of 0.4% on the S&P 500, wrapping up the week with a tidy 1.3% advance to leave the blue-chip gauge with a gaudy 29% total return since April 8. The Treasury curve flattened with 30-year yields dipping four basis points to 4.92% while the two-year note held at 3.91%. WTI crude dropped to US$65 a barrel, gold remained under pressure at US$3,339 per ounce, bitcoin retreated to US$117,000 and the VIX sank below 15.
From AAP:
On Friday, the Australian bourse lost ground despite US gains the night prior. The benchmark S&P/ASX200 index on Friday dropped 0.49% to 8,666.9, while the broader All Ordinaries was down 0.5% to 8,934.3.
For the week, the ASX200 dropped 1%, its worst weekly performance since a 3.9% decline in the first week of April.
Six of the ASX's 11 sectors finished lower on Friday and two closed higher, with industrials, telecommunications and utilities all basically flat.
Energy was the biggest mover, lifting 1.8% as Woodside added 3.7%.
The big four banks continued to lose ground, with Westpac dropping 0.8% to $33.03, ANZ losing 0.7% to $30.22 and CBA and NAB both shedding 0.4%, to $172.87 and $37.51 respectively.
Miners were also disappointed, with BHP losing 1.9% to $40.80, Fortescue dropping 3.4% to $18.35 and Rio Tinto falling 0.8% to $118.86. Goldminers slipped except producer Newmont, which rose 3.81% after reporting a quarterly adjusted net income of more than $2.4 billion.
KMD Brands rose 4.4% after Qantas executive Carla Webb-Sear was appointed the Kathmandu and Rip Curl parent company's chief financial officer.
From Shane Oliver, AMP:
Global share markets pushed higher again over the last week with US shares up 1.5% helped by a trade deal with Japan and good earnings results. Japanese shares rose 4.1% for the week to near record highs helped by the trade deal. Eurozone shares rose 0.3% and Chinese shares rose 1.7%. Despite the positive US lead, Australian shares fell 1% for the week reflecting profit taking after a surge higher the previous week. Resources and health stocks rose but this was more than offset by falls in consumer and financial shares, with CBA down 9.7% from its recent record high after it nearly doubled in price over two years. Bond yields were little changed – down slightly in the US, but up in Germany, Japan and Australia. Oil and gold prices fell but copper and iron ore prices rose. The $A rose as the $US came under renewed downwards pressure. Bitcoin was little changed.
In Australia, the message from the RBA remains of a “cautious and gradual” approach to easing monetary policy – with Governor Bullock RBA noting that the risk of a severe trade war appears to have diminished, monthly CPI data suggests that June quarter trimmed mean inflation may not fall as much as forecast in May and that monthly unemployment data “pop up and down” and so the June rise in unemployment should not be over interpreted. Our base case remains for 0.25% rate cuts in August, November, February and May. June quarter inflation data on Wednesday will be key, and we expect the all-important trimmed mean to come out in line with RBA forecasts for a 2.6%yoy rise. However, there is some upside risk to this, so in terms of sensitivity around what it will mean for the August RBA meeting, we would regard a 2.8%yoy rise in trimmed mean inflation or less as consistent with a rate cut, but 2.9%yoy or more would mean a high risk of the RBA remaining on hold again. The money market sees a 98% chance of an August rate cut, which is probably a bit too high – we would put it at around 80%.
Curated by James Gruber and Leisa Bell
Latest updates
PDF version of Firstlinks Newsletter
ASX Listed Bond and Hybrid rate sheet from NAB/nabtrade
Listed Investment Company (LIC) Indicative NTA Report from Bell Potter
LIC Monthly Report from Morningstar
Plus updates and announcements on the Sponsor Noticeboard on our website