Register For Our Mailing List

Register to receive our free weekly newsletter including editorials.

Home / 526

Every era has its hot stocks. Will AI defy gravity?

In the world of finance, few phrases are potentially as wealth destructive as 'this time it’s different'. Yet, during a period when the mere mention of artificial intelligence (AI) has sent valuations soaring, many are wondering if this time it really is different.

AI is undoubtedly a game-changer, impacting virtually every industry. History is filled with such transformative moments – and every era has its hot stocks. Before AI, it was the Internet. Prior to that, the world was bracing for Japan’s economic dominance – until it wasn’t. Conglomerates and oil companies, the “Nifty Fifty” of the 1970s have all had their moment in the sun.

So, is the euphoria around AI justified? Or should investors be bracing for an inevitable downfall? There are reasons to believe that this time might indeed be different. In the new AI economy, scale matters. Companies such as Nvidia, which is providing the proverbial picks and shovels for this new gold rush and which recently announced its sales would jump 170% this quarter, underscore this trend.

What history has to say

Yet, questions remain: is there room for the next college roommates with a disruptive big idea? Is the next Microsoft waiting in the wings? To gain perspective on these questions, we dived deep into the history of the US stock market, looking at the top 100 stocks (by market cap weight) at the end of every decade from the 1960s through to the 2010s and examining where the leaders of each decade were 10 years on (see Figure 1). While the end of a decade may seem like an arbitrary cutoff point, we chose to separate time accordingly.

Figure 1. Leaders from Each Era Had a Smaller Market Weight a Decade Later

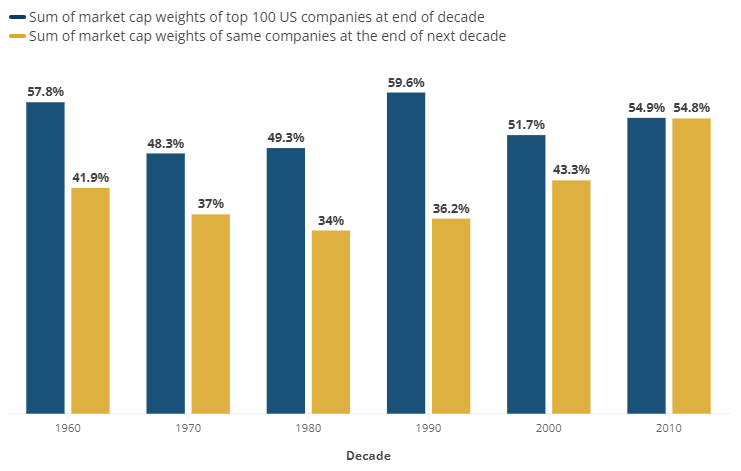
Source: Man Numeric. Data covers period from 30 September 1962 to 31 December 2022. For 2010, ‘end of next decade’ covers period from 1 January 2010 through to 31 December 2022.

What we found most striking is just how strong gravity has typically been. Reaching the top 100 in any decade has been no guarantee of success in the next. In each of the five full decades we studied, the weight of the top 100 stocks at the end of one decade was materially lower in the next. The decade following the dot-com craze of the 1990s (the 2000s) witnessed the lowest survival rate in our study with only 73% of stocks remaining a decade later (see Figure 2).

Figure 2. Survival Rate of Leaders a Decade Later

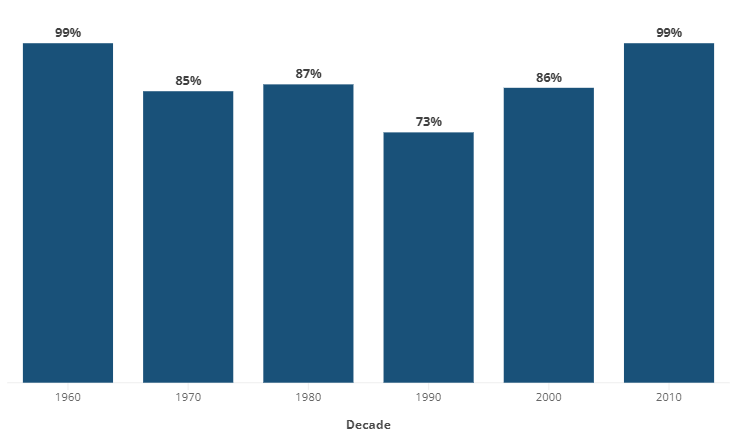
Source: Man Numeric. Data covers period from 30 September 1962 to 31 December 2022. For 2010, ‘a decade later’ covers period from 1 January 2010 through to 31 December 2022.

Over a full market cycle, new leaders typically emerge, with some exceptions, notably being in the 2010s, as recent market leaders have become somewhat entrenched. With that said, while it’s true that Microsoft did in fact largely become the “General Motors of the Internet” and is still going strong, it has largely proved to be the exception, rather than the rule, at the individual stock level.

Current breed has proven resilient

While acknowledging that the current decade is still young, the leaders from the end of the last decade (2019) have also shown remarkable resilience thus far with the sum of the top 100 weights remaining steady at about 54%.

Returning to our initial question then: is this time different? Perhaps. But history tells us that even in the throes of excitement over new technology and its potential, asset prices may creep ever higher in the short term, but often disappoint in the longer term in the face of elevated expectations. The rise of AI is a thrilling new chapter in the ongoing saga of market disruption, but as investors navigate this new terrain, they would do well to remember the tales of past market heroes and their eventual fates.


Michael Dowd is Head of Investment Risk, Man Numeric. Man Group is a specialist investment manager partner of GSFM Funds Management, a sponsor of Firstlinks. GSFM represents Man AHL and Man GLG in Australia. The information included in this article is provided for informational purposes only. Any opinions expressed in this material reflect our judgment at this date, are subject to change and should not be relied upon as the basis of your investment decisions.

For more articles and papers from GSFM and partners, click here.


RELATED ARTICLES

Unearthing small and mid-cap gems

A 30-minute article using OpenAI … and there goes my job

When algorithms go rogue the havoc is all too human

banner

Most viewed in recent weeks

The case for the $3 million super tax

The Government's proposed tax has copped a lot of flack though I think it's a reasonable approach to improve the long-term sustainability of superannuation and the retirement income system. Here’s why.

7 examples of how the new super tax will be calculated

You've no doubt heard about Division 296. These case studies show what people at various levels above the $3 million threshold might need to pay the ATO, with examples ranging from under $500 to more than $35,000.

The revolt against Baby Boomer wealth

The $3m super tax could be put down to the Government needing money and the wealthy being easy targets. It’s deeper than that though and this looks at the factors behind the policy and why more taxes on the wealthy are coming.

Meg on SMSFs: Withdrawing assets ahead of the $3m super tax

The super tax has caused an almighty scuffle, but for SMSFs impacted by the proposed tax, a big question remains: what should they do now? Here are ideas for those wanting to withdraw money from their SMSF.

The super tax and the defined benefits scandal

Australia's superannuation inequities date back to poor decisions made by Parliament two decades ago. If super for the wealthy needs resetting, so too does the defined benefits schemes for our public servants.

Are franking credits hurting Australia’s economy?

Business investment and per capita GDP have languished over the past decade and the Labor Government is conducting inquiries to find out why. Franking credits should be part of the debate about our stalling economy.

Latest Updates

Superannuation

Here's what should replace the $3 million super tax

With Div. 296 looming, is there a smarter way to tax superannuation? This proposes a fairer, income-linked alternative that respects compounding, ensures predictability, and avoids taxing unrealised capital gains. 

Superannuation

Less than 1% of wealthy families will struggle to pay super tax: study

An ANU study has found that families with at least one super balance over $3 million have average wealth exceeding $19 million - suggesting most are well placed to absorb taxes on unrealised capital gains.   

Superannuation

Are SMSFs getting too much of a free ride?

SMSFs have managed to match, or even outperform, larger super funds despite adopting more conservative investment strategies. This looks at how they've done it - and the potential policy implications.  

Property

A developer's take on Australia's housing issues

Stockland’s development chief discusses supply constraints, government initiatives and the impact of Japanese-owned homebuilders on the industry. He also talks of green shoots in a troubled property market.

Economy

Lessons from 100 years of growing US debt

As the US debt ceiling looms, the usual warnings about a potential crash in bond and equity markets have started to appear. Investors can take confidence from history but should keep an eye on two main indicators.

Investment strategies

Investors might be paying too much for familiarity

US mega-cap tech stocks have dominated recent returns - but is familiarity distorting judgement? Like the Monty Hall problem, investing success often comes from switching when it feels hardest to do so.

Latest from Morningstar

A winning investment strategy sitting right under your nose

How does a strategy built around systematically buying-and-holding a basket of the market's biggest losers perform? It turns out pretty well, so why don't more investors do it?

Sponsors

Alliances

© 2025 Morningstar, Inc. All rights reserved.

Disclaimer
The data, research and opinions provided here are for information purposes; are not an offer to buy or sell a security; and are not warranted to be correct, complete or accurate. Morningstar, its affiliates, and third-party content providers are not responsible for any investment decisions, damages or losses resulting from, or related to, the data and analyses or their use. To the extent any content is general advice, it has been prepared for clients of Morningstar Australasia Pty Ltd (ABN: 95 090 665 544, AFSL: 240892), without reference to your financial objectives, situation or needs. For more information refer to our Financial Services Guide. You should consider the advice in light of these matters and if applicable, the relevant Product Disclosure Statement before making any decision to invest. Past performance does not necessarily indicate a financial product’s future performance. To obtain advice tailored to your situation, contact a professional financial adviser. Articles are current as at date of publication.
This website contains information and opinions provided by third parties. Inclusion of this information does not necessarily represent Morningstar’s positions, strategies or opinions and should not be considered an endorsement by Morningstar.