Register For Our Mailing List

Register to receive our free weekly newsletter including editorials.

Home / 195

Future oil prices: it takes two to contango

The recovery in oil prices during the past year, as measured by the price of Brent Crude Oil, has provided a welcome respite for investors exposed to direct commodities, energy-related stocks and high-yield debt, particularly for North American shale oil producers.

While short-term predictions are fraught with danger, futures markets provide context as to where market participants believe oil prices should be over the medium term. This article provides a deeper understanding of oil pricing dynamics and the prospects for crude oil prices [Editor's Note: a 'contango' is where the futures or forward price of a commodity is above the spot price].

Forward curve dynamics

Futures markets provide an insight into the incentive pricing for producers, hedgers, and speculators to act. The spot price is typically quoted on news and business channels, but futures markets provide price points for multiple tenors in the future which can be used by market participants to either hedge production, hedge-pricing risk for buyers, or take a position, as is the case for speculators.

Further ‘along the curve’ (looking at prices that are at least six to 12 months in the future), there tends to be less noise and more signals which are reflective of market fundamentals. If this were not the case, there would be an opportunity to arbitrage for those investors able to participate in both the physical (spot) market and hedge using futures.

Brent Crude Oil forward curve fair value per barrel in US Dollars
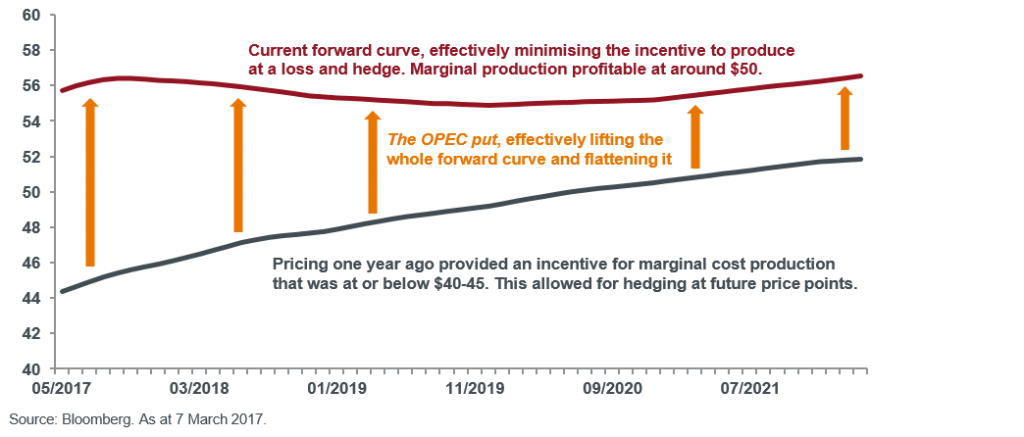
The chart shows forward pricing for Brent Crude Oil as of 7 March 2017 (the ‘forward curve’, shown in red) and compares this to the forward curve one year ago (shown in grey).

The chart provides a number of insights:

1. Oil markets are back in balance

Since the announcement by OPEC in late 2016 of production limits, oil markets have been rebalancing. While this doesn’t negate the effect of currently high levels of global inventories, the forward curves illustrate how the forward curve has effectively shifted up and flattened. This is historically associated with positive performance for the immediate future as there is less incentive to produce today and forward hedge (prices are flat for the immediate future).

2. Shale picks up market share, ‘ROPEC’ picks up revenue

The wild card in the oil market deck is now North American shale oil production. A combination of recent increases in rig counts and falling marginal costs for certain oil basins mean that OPEC shares swing production with US shale producers.

Current pricing provides an incentive for more marginal production to come on line in the US, so this will likely translate into higher market share for shale as a percentage of global oil production, while OPEC and Russia (AKA ‘ROPEC’) benefit via increased revenues, albeit at lower production levels.

3. Aramco IPO in the balance

It is in the interests of the Saudi Arabians to maintain prices around these levels. With the proposed IPO of Aramco in the next two years, its oil assets would be priced at the average price of the past 12 months. A major objective of Saudi oil production would be to maintain pricing at these levels to keep them low enough not to encourage a major increase in shale production, but high enough to provide a reasonable valuation on oil reserves. The Aramco IPO could potentially make it the largest listed oil company in the world, above Exxon Mobil Corporation.

Conclusion on the oil market

Current oil market pricing in the mid-US$50 range is a ‘sweet spot’ for all major oil market participants, including OPEC, Russia and the more productive and cost efficient North American shale producers. Barring unexpected events, oil prices will likely remain range-bound for the medium term, with an effective floor of around US$50 as the base case. The abyss oil markets experienced in early 2016 provided an insight into the instability created by an oversupply in energy markets, and this will be front and centre to ‘ROPEC’ in encouraging strict compliance with production quotas.


Andrew Kaleel and Matthew Kaleel are Co-heads of Global Commodities & Managed Futures at Henderson Global Investors. This information is general only and does not take into account the personal circumstances or financial objectives of any reader.


  •   23 March 2017
  •      
  •   


Leave a Comment:

RELATED ARTICLES

Oil does not have a supply side problem

The end of Russian oil

The tipping point for investing in decarbonisation

banner

Most viewed in recent weeks

It’s time for LICs to die

A high-profile dividend cut and a prominent fund manager’s apology have reignited a long-running debate. If investors can access similar exposures more cheaply and efficiently elsewhere, what exactly is keeping LICs alive?

Testamentary trusts survived the trust tax. The drafting battle has just begun.

The fight over testamentary trusts looked settled. Then the draft legislation arrived. Hidden in a technical detail is a question that could force many families to rethink wills they thought were already future-proof.

Is it time to bail on Australian stocks?

For generations, Australian investors have backed banks, miners and dividends. But has that loyalty come at a cost? A look at the numbers raises an uncomfortable question about where future returns will come from.

The new capital gains tax trap for your portfolio

Investors have long accepted one portfolio rule without much question. A major tax shift could change that calculation entirely, forcing difficult trade-offs between risk, discipline and an overlooked cost lurking beneath.

How the typical Australian Family could save $844,350 in taxes

The value of a testamentary trust is not determined by wealth alone. Depending on circumstances, it can reduce the tax burden on inherited income, create efficiencies and help build intergenerational wealth.

The housing slide could become a crash

House prices are sliding across Australia, yet the most dangerous ingredient for a housing crash is still missing. If job losses surge amid growing economic risks, today's correction could become a historic property downturn.

Latest Updates

Retirement

The retirement scorecard: how many of these questions can you answer?

From the maths of retirement, estimating spending and picking the right asset allocation to survive a poor decade, here are the questions every retiree – current or future – should be able to answer for themselves.

2026 is not 1999

The US market looks eerily similar to the dot-com era with soaring AI spending and tech giants dominating returns. But one difference separates today’s boom from the dot-com bubble and it could determine what happens next.

Planning

Taxing time for trusts

Trusts are facing a shake-up, but an overhaul may not be necessary. Families can explore restructuring strategies that preserve succession and the asset protection benefits that have made these structures valuable.

Economy

Why the US economy is stronger than you might think

War, inflation and higher rates were expected to derail America. But has the market got it wrong? Three forces are driving the economy beyond expectations, revealing implications for stock prices and portfolio positioning.

Gold

How much trust is in your portfolio?

Everyone talks about diversifying assets. Far fewer think about diversifying trust. As inflation, debt and market assumptions collide, the question is whether portfolios need greater protection from unexpected outcomes.

Retirement

Retirement in reality - 7 months in

Seven months into retirement, I'm still uncovering surprises. This month was spent reflecting on the slow pace of health change, the myth of neatly scheduled part-time work and the unexpected persistence of retirement guilt.

The new geography of technology leadership

The next chapter of technology may not belong to the companies or business models many expect. As the landscape shifts, some opportunities are emerging in places that remain surprisingly overlooked by global markets.

Sponsors

Alliances

  • ASA-Logo-RGB-ActiveGreen-web.png

© 2026 Morningstar, Inc. All rights reserved.

Disclaimer
The data, research and opinions provided here are for information purposes; are not an offer to buy or sell a security; and are not warranted to be correct, complete or accurate. Morningstar, its affiliates, and third-party content providers are not responsible for any investment decisions, damages or losses resulting from, or related to, the data and analyses or their use. To the extent any content is general advice, it has been prepared for clients of Morningstar Australasia Pty Ltd (ABN: 95 090 665 544, AFSL: 240892), without reference to your financial objectives, situation or needs. For more information refer to our Financial Services Guide. You should consider the advice in light of these matters and if applicable, the relevant Product Disclosure Statement before making any decision to invest. Past performance does not necessarily indicate a financial product’s future performance. To obtain advice tailored to your situation, contact a professional financial adviser. Articles are current as at date of publication.
This website contains information and opinions provided by third parties. Inclusion of this information does not necessarily represent Morningstar’s positions, strategies or opinions and should not be considered an endorsement by Morningstar.