Register For Our Mailing List

Register to receive our free weekly newsletter including editorials.

Home / 192

HNW asset allocation and advice trends

In an advanced look at the results, the 2016 Investment Trends High Net Worth (HNW) Investor Report updates research on the use of advisers and the latest asset allocations.

The study is based on 2,500 responses from HNWs with investible assets (excluding super in public funds but including SMSF balances) of over $1 million, net of debt. This group is estimated to control about $9 billion of the $1.5 trillion held by all HNWs in Australia.

Some highlights include:

1. The number of HNWs in Australia fell to 425,000 in 2016 from 440,000 in 2015, partly due to market conditions and partly because of using debt to invest in property. The number with $2.5 million and above is growing.

2. The main investment problem identified by half the respondents is they are seeking growth in their portfolios but don’t expect it will come from Australian shares in 2017 (their return expectations have recovered somewhat since bottoming in September 2016, but they are still bearish). They know they should not allocate significantly to cash.

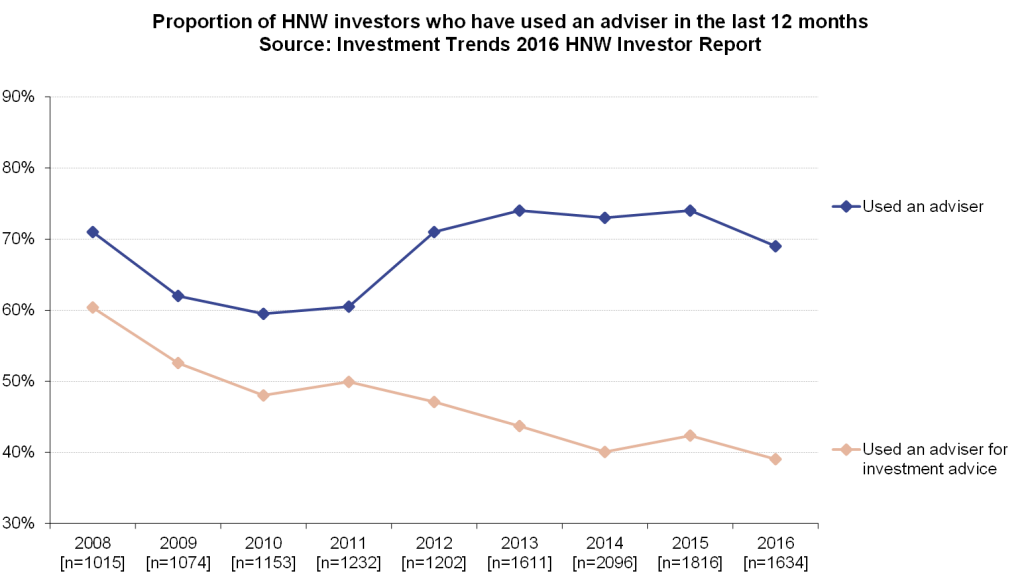
3. As expected in such uncertain times, there is an increasing unmet need for advice. Says Recep III Peker, Research Director at Investment Trends, “Over half of HNWs have large unmet needs for advice. In spite of this, they are increasingly reticent to seek advice, and the use of advisers is falling. Financial planners and full service stock brokers are losing ground, especially for investment advice.”

The changes for full service stockbrokers are particularly challenging. Those who have retained clients have a more holistic relationship, including in asset classes other than equities. But only 40% will actually call themselves a stockbroker, with most preferring names such as ‘wealth managers’, signifying a more diversified offering. They have not become ‘financial planners’, but their businesses are changing. For example, they commonly sell global ETFs to give their clients an international equity exposure.

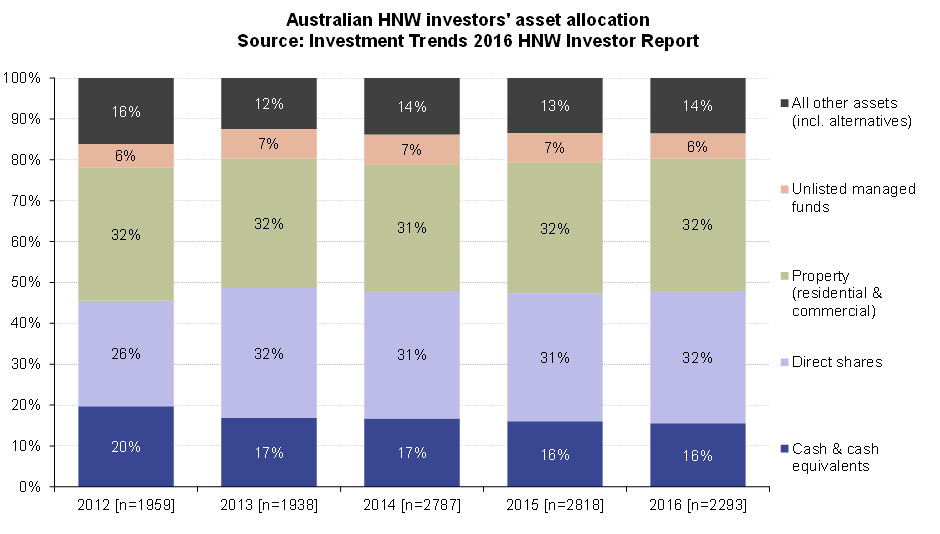
4. Asset allocation has not changed significantly in last few years. The top-level asset distribution is 32% direct shares, 32% property, 16% cash and TDs and the rest in listed or unlisted managed funds and alternatives. Geographically, the proportion of assets overseas averages only 5%, although for the wealthy with assets $10m+, it is a much higher 10%.

Uncertain times and stretched market values seem to have paralysed reallocation. The amount in cash and TDs has fallen slightly by 1% to 16% in the last two years, despite uncertainty in the share market, due to low rates. HNWs in Australia are estimated to be holding $240 billion in cash, with $100 billion temporarily waiting for better market conditions.

The proportion of HNWs planning to invest in managed funds remained at 20% in 2016. About half of these HNWs want actively managed international equity funds, and two in five seek active Australian equity funds. Says Peker, “It’s been a bit of a missed opportunity that the industry has not grown its share of the HNW pie, but there is still good appetite for managed funds.”

The number of HNWs who have direct property has increased but average holding size has come down, perhaps indicating property is held in an SMSF.


Graham Hand is Managing Editor of Cuffelinks and this preliminary release is courtesy of Investment Trends.

7 Comments
Andrew Varlamos
March 14, 2017

Thanks Graham. How do you interpret the first graph: specifically, who are the "advisers" who are not giving investment advice? Accountants? Or insurance agents/advisers? Does the study explain this?
Cheers
Andrew

Graham
March 14, 2017

Hi Andrew. Recep has provided this clarification: The main driver of the gap between the two metrics are accountants for tax advice, who were used by nearly half of HNWs in 2016. Even accountants have lost ground over the past few years, with the share of relationships falling from 56% in 2013 to 48% in 2016.

Andrew Varlamos
March 14, 2017

Thanks Graham

Roger
March 03, 2017

Thanks for the article, Graham. Interesting that your bar charts have no segment for 'bonds - listed plus unlisted'. I understand the allocation is indeed low - far too low, according to many standards.

VeryAverageJoe
March 02, 2017

Hi Graham, fair call. My bad. Cheers, C.

VeryAverageJoe
March 02, 2017

Graham, hi, interested you cherry-picked one quote from Uncle Warren's annual missive without mentioned the shellaking he gave the funds management trade for their collective results v low cost index thumping given over his 10 year comparison bet. Don't ask the barber if you need a haircut, right?! Reader's might like to start at page 21 of the recent Berkshire 2016 letter (google it) while I keep reading Where are All the Customer's Yachts? Funds management has it's place and purpose no doubt, but the lofty heights may not always be that place. Cheers matey, C.

Graham Hand
March 02, 2017

Hi VAJ, not sure a 'cherry pick' is fair when I simply quoted one optimistic line from Buffett that had nothing to do with funds management. Cuffelinks has published many articles on the index v active debate, showing how most active managers struggle to outperform. Not defending it, but his comparison bet was against a basket of hedge funds, where the fees are higher than the 'average' long-only manager. Certainly, indexing has a role in many portfolios.


Leave a Comment:

RELATED ARTICLES

Five charts show predicaments facing financial advice

Now you can earn 5% on bonds but stay with quality

Reducing the $5,300 upfront cost of financial advice

banner

Most viewed in recent weeks

Australian house prices close in on world record

Sydney is set to become the world’s most expensive city for housing over the next 12 months, a new report shows. Our other major cities aren’t far behind unless there are major changes to improve housing affordability.

The case for the $3 million super tax

The Government's proposed tax has copped a lot of flack though I think it's a reasonable approach to improve the long-term sustainability of superannuation and the retirement income system. Here’s why.

7 examples of how the new super tax will be calculated

You've no doubt heard about Division 296. These case studies show what people at various levels above the $3 million threshold might need to pay the ATO, with examples ranging from under $500 to more than $35,000.

The revolt against Baby Boomer wealth

The $3m super tax could be put down to the Government needing money and the wealthy being easy targets. It’s deeper than that though and this looks at the factors behind the policy and why more taxes on the wealthy are coming.

Meg on SMSFs: Withdrawing assets ahead of the $3m super tax

The super tax has caused an almighty scuffle, but for SMSFs impacted by the proposed tax, a big question remains: what should they do now? Here are ideas for those wanting to withdraw money from their SMSF.

The super tax and the defined benefits scandal

Australia's superannuation inequities date back to poor decisions made by Parliament two decades ago. If super for the wealthy needs resetting, so too does the defined benefits schemes for our public servants.

Latest Updates

Planning

Will young Australians be better off than their parents?

For much of Australia’s history, each new generation has been better off than the last: better jobs and incomes as well as improved living standards. A new report assesses whether this time may be different.

Superannuation

The rubbery numbers behind super tax concessions

In selling the super tax, Labor has repeated Treasury claims of there being $50 billion in super tax concessions annually, mostly flowing to high-income earners. This figure is vastly overstated.

Investment strategies

A steady road to getting rich

The latest lists of Australia’s wealthiest individuals show that while overall wealth has continued to rise, gains by individuals haven't been uniform. Many might have been better off adopting a simpler investment strategy.

Economy

Would a corporate tax cut boost productivity in Australia?

As inflation eases, the Albanese government is switching its focus to lifting Australia’s sluggish productivity. Can corporate tax cuts reboot growth - or are we chasing a theory that doesn’t quite work here?

Are V-shaped market recoveries becoming more frequent?

April’s sharp rebound may feel familiar, but are V-shaped recoveries really more common in the post-COVID world? A look at market history suggests otherwise and hints that a common bias might be skewing perceptions.

Investment strategies

Asset allocation in a world of riskier developed markets

Old distinctions between developed and emerging market bonds no longer hold true. At a time where true diversification matters more than ever, this has big ramifications for the way that portfolios should be constructed.

Investment strategies

Top 5 investment reads

As the July school holiday break nears, here are some investment classics to put onto your reading list. The books offer lessons in investment strategy, financial disasters, and mergers and acquisitions.

Sponsors

Alliances

© 2025 Morningstar, Inc. All rights reserved.

Disclaimer
The data, research and opinions provided here are for information purposes; are not an offer to buy or sell a security; and are not warranted to be correct, complete or accurate. Morningstar, its affiliates, and third-party content providers are not responsible for any investment decisions, damages or losses resulting from, or related to, the data and analyses or their use. To the extent any content is general advice, it has been prepared for clients of Morningstar Australasia Pty Ltd (ABN: 95 090 665 544, AFSL: 240892), without reference to your financial objectives, situation or needs. For more information refer to our Financial Services Guide. You should consider the advice in light of these matters and if applicable, the relevant Product Disclosure Statement before making any decision to invest. Past performance does not necessarily indicate a financial product’s future performance. To obtain advice tailored to your situation, contact a professional financial adviser. Articles are current as at date of publication.
This website contains information and opinions provided by third parties. Inclusion of this information does not necessarily represent Morningstar’s positions, strategies or opinions and should not be considered an endorsement by Morningstar.