Register For Our Mailing List

Register to receive our free weekly newsletter including editorials.

Home / 374

Let’s clarify growth/defensive and move forward

There are many ways to measure exposure and risk. No single metric is perfect which is why professional risk managers use multiple measures of risk.

Many parts of the financial services industry classify portfolios based on a measure known as growth/defensive exposure. Growth/defensive has its fair share of flaws but it appears entrenched as an industry measure. However, there currently exists a one-off opportunity to improve the metric and make it standardised. All members of the investment community are encouraged to participate in the consultation currently open.

How do we use growth/defensive?

Growth/defensive exposure is used in many different ways, including:

  1. Research houses create super fund peer groups for performance comparisons, such as grouping together all funds classed as 60% growth/40% defensive.
  2. APRA’s Heatmap methodology assesses super funds by risk and return.
  3. Financial planners define growth/defensive categories to map clients to portfolios based on their risk tolerance.

For all its use in industry, growth/defensive remains undefined. As a result, there is a large degree of subjectivity, whether by industry when they self-assess or by groups such as APRA which has developed its own simple approaches, thereby introducing hard-coded subjectivity. These variations reduce confidence in any analysis produced using growth/defensive.

Industry attempts to standardise

Presently there is an industry-led project to create a standardised approach for assessing growth/defensive exposure to be used by all industry participants including regulators.

A working group (detailed here) was formed by volunteers from research houses and super funds. Following more than a year’s work, a proposed solution has been released for consultation.

Already there has been a high level of participation in the consultation process. Industry participants are encouraged to contribute and feedback will inform a better solution.

Consider the following puzzles:

  • If we followed traditional thinking that defensive assets are cash and bonds and growth assets are generally equities which participate in economic performance, where does that leave alternative investment products which can exhibit sizable risk, which could be independent of equities?
  • If we took a risk-based approach then should there be different scores among the universe of cash and fixed interest products, as they exhibit varying degrees of risk?

Pragmatism was the key to coming up with a solution. The working group stopped trying to come up with a definition (we accepted it as a hybrid measure of exposure and risk) and focused on the following:

  1. A quality measure that broadly reflects the risk/exposure consistently across different multi-asset portfolios
  2. A measure that doesn’t distort the portfolio decision-making process (compared to a decision made in a traditional risk/return framework)
  3. Manageable degree of operational impact.

We often found that these desires pulled against each other. Achieving a balance was the challenge.

Examples of growth/defensive asset scores

The proposed solution is outlined in the diagram below.

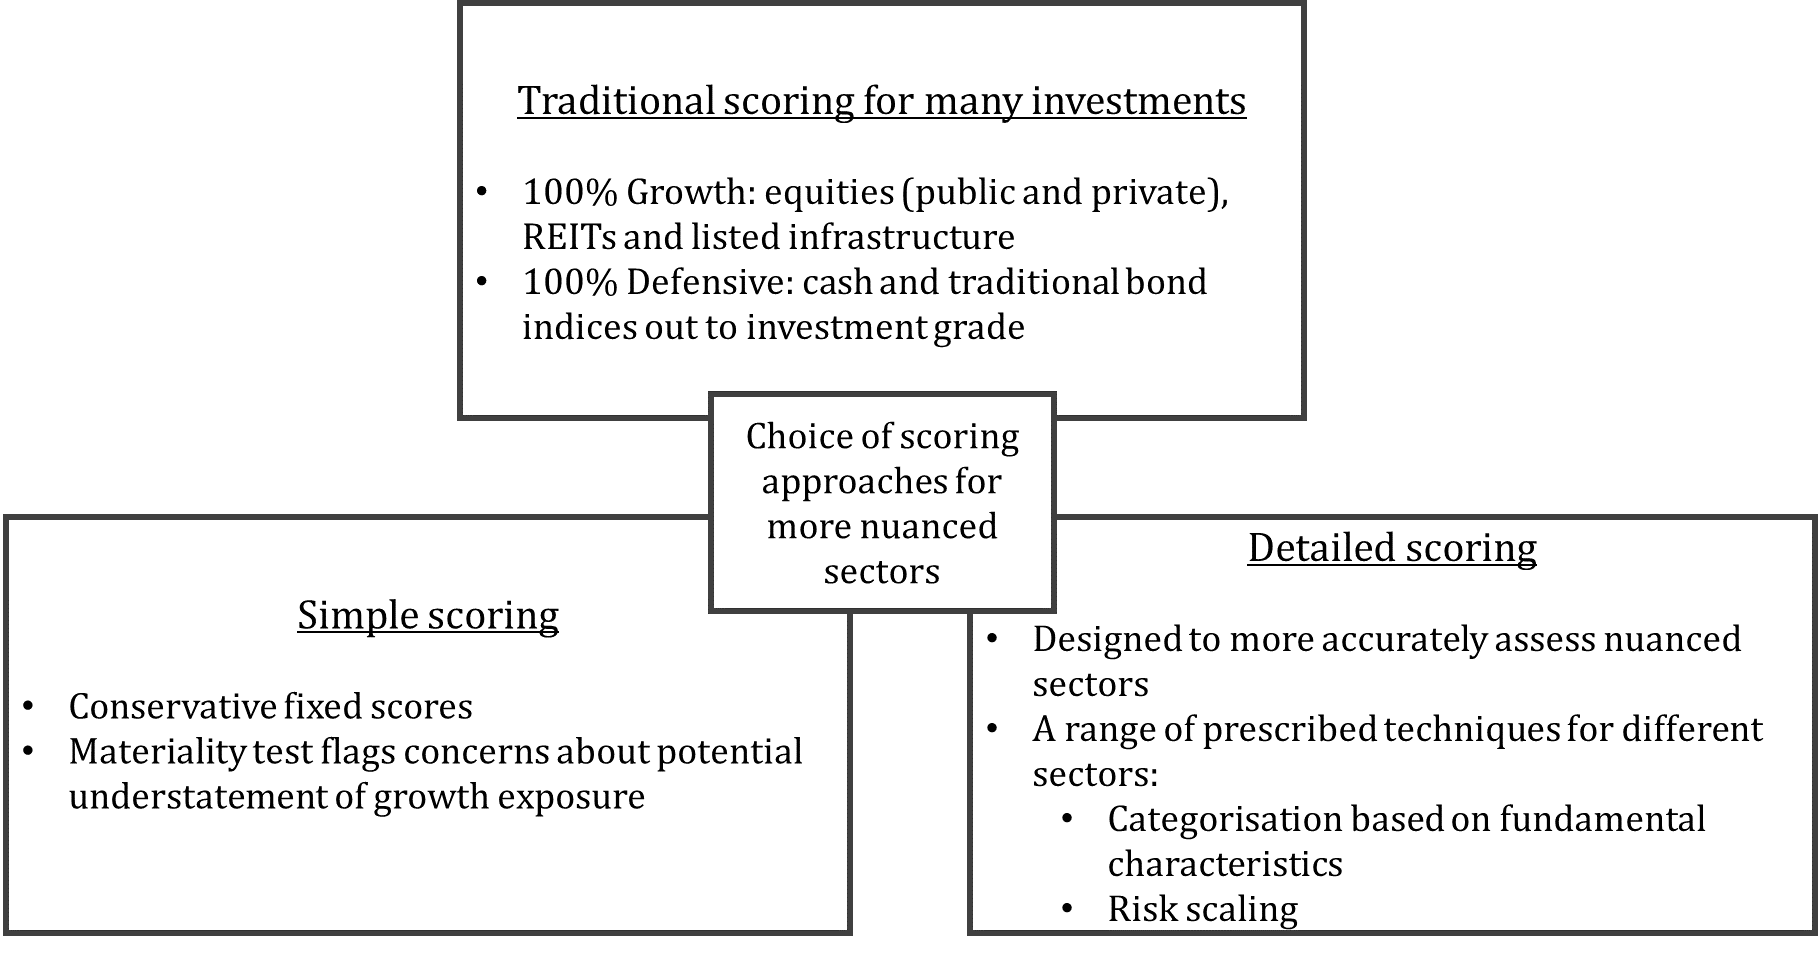
A couple of case studies help to illustrate the detailed scoring process:

Property and infrastructure. Fundamental criteria such as leverage levels and asset purpose (lower-risk income or higher-risk development) channel assets into two categories: Tier 1 risk (scored 60% growth/40% defensive) and Tier 2 risk (100% growth).

Hedge funds. The level of risk taken or targeted by the hedge fund is scaled to determine a growth/defensive score. Consider the simplified case of two hedge funds who target 6% and 12% volatility. Under our risk scaling approach, we scale the product volatility by 12% to determine that the two hedge funds would score 50% growth/50% defensive and 100% growth respectively.

Full details of the proposal are here.

It may be a healthy exercise for SMSFs to estimate their own growth/defensive score. The process we have detailed provides a healthy reminder that not all unlisted property has the same characteristics, that there is a huge dispersion among alternative investment products and that higher yielding credit can carry significant risk.

The working group was unable to incorporate portfolio diversification benefits into the solution. A variety of investments with different risk drivers should result in lower portfolio risk compared to the weighted sum of those individual risk exposures. But how do you standardise this calculation when there are so many investments?

Not being able to incorporate diversification benefits should be viewed as a limitation of growth/defensive as a risk measure. It serves as a reminder to those groups that use growth/defensive, including APRA, that the definition should be complemented by other approaches to measuring exposure and risk when undertaking analysis.

Feedback welcome

The aim is for a single industry solution and a standardised approach. At present the industry is under the microscope as never before. All feedback will be shared with the working group. The consultation paper is found here and the consultation closes on Monday 28 September.

Hopefully this will provide clear headspace for industry to move beyond growth/defensive and start using a variety of measurements to assess risk and performance. Thank you to the working group for all their contributions.


David Bell is Executive Director of The Conexus Institute, a not-for-profit research institution focused on improving retirement outcomes for Australians.


4 Comments
David Bell
September 09, 2020

I hope standardisation will improve accountability (it won't be perfect because growth / defensive is not without its flaws). But it will be easier for funds to understand how they are performing relatively and whether adjustments need to be made. There are potential challenges at both ends of the peer group tables: strong performing funds are sometimes viewed sceptically (perhaps fairly or unfairly), while poorer performers may claim it is because of how they categorise their assets (perhaps or perhaps not a valid claim). Better accountability will over time improve consumer outcomes.

Retired
September 09, 2020

This project falls at the first hurdle when it uses volatility as some sort of risk measure. The primary concern of the ‘senior savers’ I know is to firstly understand what part of the portfolio is ‘guaranteed defensive’ as we are not in a position to go back to accumulation mode. Everything else is therefore not defensive but some variant of growth/risky. Just define genuine defensive and forget about the rest, including the notion that a property can somehow be both defensive and growth - when its value falls the loss can not be apportioned?

David Bell
September 10, 2020

Thanks for your comment. I don't disagree with your view, but existing legacies prove constraining. While we think that consumers will indirectly benefit from better accountability provided by a standardised approach, I view this as a solution for industry more than a direct consumer solution. To give you some insight into the breadth of our work we did we develop a cash / defensive / growth framework, but when we consulted many of the people who use growth / defensive and have systems set up around it, they said this is a step too far. So how do we progress? I believe it is better to improve the growth / defensive measure while in parallel encouraging industry and regulators to explore, develop and implement other metrics.

Aussie HIFRE
September 09, 2020

It would certainly be very useful to have an industry wide standard of what counts as growth and what counts as defensive. Certainly at the moment there are a lot of industry super funds which claim to be "Balanced" but have up to 95% of their investments in what most people would call growth type investments. Completely unsurprisingly in an upmarket they then outperform retail funds which have only 50% in growth assets, or other industry funds with 70% in growth assets.


Leave a Comment:

RELATED ARTICLES

Asset allocation in a world of riskier developed markets

Clime time: Asset allocation decisions for SMSFs

Investing across deflation, inflation and stagflation

banner

Most viewed in recent weeks

Raising the GST to 15%

Treasurer Jim Chalmers aims to tackle tax reform but faces challenges. Previous reviews struggled due to political sensitivities, highlighting the need for comprehensive and politically feasible change.

7 examples of how the new super tax will be calculated

You've no doubt heard about Division 296. These case studies show what people at various levels above the $3 million threshold might need to pay the ATO, with examples ranging from under $500 to more than $35,000.

Are franking credits hurting Australia’s economy?

Business investment and per capita GDP have languished over the past decade and the Labor Government is conducting inquiries to find out why. Franking credits should be part of the debate about our stalling economy.

Here's what should replace the $3 million super tax

With Div. 296 looming, is there a smarter way to tax superannuation? This proposes a fairer, income-linked alternative that respects compounding, ensures predictability, and avoids taxing unrealised capital gains. 

The rubbery numbers behind super tax concessions

In selling the super tax, Labor has repeated Treasury claims of there being $50 billion in super tax concessions annually, mostly flowing to high-income earners. This figure is vastly overstated.

9 winning investment strategies

There are many ways to invest in stocks, but some strategies are more effective than others. Here are nine tried and tested investment approaches - choosing one of these can improve your chances of reaching your financial goals.

Latest Updates

Taxation

100 Aussies: seven charts on who earns, pays, and owns

The Labor government is talking up tax reform to lift Australia’s ailing economic growth. Before any changes are made, it’s important to know who pays tax, who owns assets, and how much people have in their super for retirement.

7 key charts on the state of the Australian property market

The Australian property market stirs fierce debate - often bullish optimism versus crash predictions. But beyond the noise, seven charts reveal what's really driving prices and the outlook for residential real estate.

A simple alternative to the $3 million super tax

Division 296 aims to introduce improved fairness into the superannuation system, yet is overly complex. This scours the world for better ideas and suggests a simpler alternative which can achieve the same goals.

CBA and the index conundrum for super funds

After the hyperbolic rise in CBA shares, super funds are floating the idea of carving out the weightings of ASX bank securities and indexing them within their portfolios. This looks at why that might be a big error.

Strategy

10 policies to drive Australian productivity higher

Here's a comprehensive list of proposed reforms to fix Australia's stagnating economy, including introducing a flat income tax rate, reducing migration, and making childcare tax-deductible.

Interviews

Where to find big winners in Asia

As more money looks for a home outside the US, Asia may soon get some love. Fidelity's Anthony Srom outlines the best places in Asia to invest, including in Chinese consumer names, Indian financials, and Thailand.

Investment strategies

We have trouble understanding the time value of money

We overvalue the present and underestimate the future - it’s a cognitive glitch called hyperbolic discounting. It affects savings, spending, and loans, and it's more common - and costly - than we think. 

Sponsors

Alliances

© 2025 Morningstar, Inc. All rights reserved.

Disclaimer
The data, research and opinions provided here are for information purposes; are not an offer to buy or sell a security; and are not warranted to be correct, complete or accurate. Morningstar, its affiliates, and third-party content providers are not responsible for any investment decisions, damages or losses resulting from, or related to, the data and analyses or their use. To the extent any content is general advice, it has been prepared for clients of Morningstar Australasia Pty Ltd (ABN: 95 090 665 544, AFSL: 240892), without reference to your financial objectives, situation or needs. For more information refer to our Financial Services Guide. You should consider the advice in light of these matters and if applicable, the relevant Product Disclosure Statement before making any decision to invest. Past performance does not necessarily indicate a financial product’s future performance. To obtain advice tailored to your situation, contact a professional financial adviser. Articles are current as at date of publication.
This website contains information and opinions provided by third parties. Inclusion of this information does not necessarily represent Morningstar’s positions, strategies or opinions and should not be considered an endorsement by Morningstar.