Register For Our Mailing List

Register to receive our free weekly newsletter including editorials.

Home / 462

Long-term rates have soared, but is fixed or floating best?

The threat of higher interest rates, slower economic growth, rising inflation and deteriorating credit is making investing scary at the moment, especially in equity markets. There are few risk-free places to hide, other than short-dated government securities. However, there are income opportunities not seen for many years. With all the focus on the cash rate, many investors do not realise how much long-term bond rates are already far ahead of short-term rates.

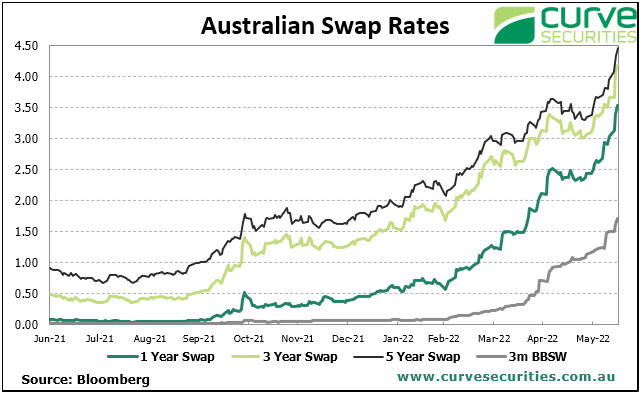
The increases in the bank swap rates in recent months have been dramatic, as shown in the chart below. With the five-year around 4.5% and high-grade securities offered at spreads of say 2% to 2.5% above the bank curve, fixed rate investors can achieve around 6.5% on quality names.

But even for investors willing to place money into bonds to take advantage of better yields, a decision is needed on whether to go fixed or floating.

Some intriguing investment opportunities

Let’s clarify some basic terminology.

A fixed rate bond means the coupon or interest rate paid over the life of the bond, say five years, is fixed for the term.

A floating rate bond means the coupon or interest rate varies according to a short-term benchmark, usually the bank bill rate in Australia, even if the term is the same five years. In other words, the rate changes every three months or 20 times over five years.

(Note that fixed interest rates have been moving significantly every day this week and the rates quoted in this article are illustrating specific points and may be out-of-date within a few days).

A recent transaction by Macquarie Bank shows the fixed versus floating opportunities. Macquarie issued a subordinated bond for $850 million and the market was happy with a credit spread of 2.7%. Investors had the opportunity of taking the 2.7% as a margin over the 3-month bank bill rate or as a margin over the five-year swap rate.

This transaction is known as a 10nc5, that is, the final term could be as long as 10 years with a ‘non-call’ period of five years. Issuers are expected to call after five years as they lose the favourable treatment as regulatory capital after year five. Macquarie was indifferent to fixed or floating because large borrowers can enter an interest rate swap to convert the fixed rate to floating or floating to fixed according to balance sheet need. Therefore, Macquarie allowed the market to decide the mix.

Based on demand, Macquarie issued $500 million of fixed rate and $350 million of floating rate. What are the investment opportunities?

1. The fixed rate component

Based on the five-year swap rate of 3.35% at the time of pricing and an issue margin of 2.7%, the fixed rate piece offered 6.05% (rates have risen since the deal was priced and it is now available above 6.5%).

For income-starved investors, here is a high-quality bank paying over 6% per annum for five years. Many retirees look to drawdown around 5% a year from superannuation as an income stream and this has been difficult to achieve for many years without depleting capital.

Two qualifications:

  1. the reason rates are rising is high inflation, and so real returns (after inflation) have not increased. However, if inflation falls from 2023 onwards, then 6% to 7% might look good.
  2. The debt is subordinated in the credit structure, a notch below Macquarie Bank deposits. It is rated Baa3/BBB/BBB+ (Moody’s, S&P, Fitch) which is the bottom rung of the ‘investment grade’ category, due to its subordination. The pricing was at a 0.1% to 0.2% premium for a new issue and about 0.2% more than CBA subordinated issues which are rated higher (Baa1/BBB+/A-) (Moody’s, S&P, Fitch).

2. The floating rate component

The floater also carries a 2.7% margin. Based on a bank bill rate of say 1.5%, the initial return would be 4.2% (2.7%+1.5%), or significantly less for the first period than on the fixed rate tranche.

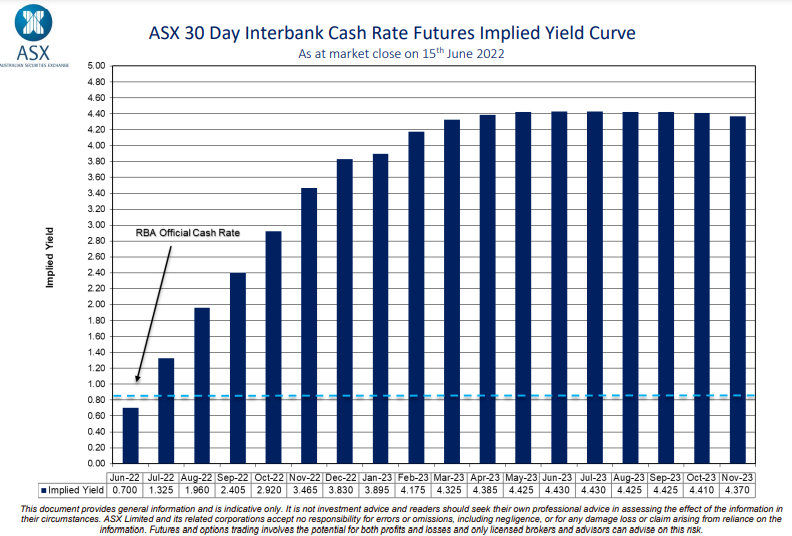
The chart below shows the 30-day cash rate futures curve until the end of 2023. At the time of writing, the market is expecting short-term rates to reach 4.4% by May 2023. A rate set with a margin of 2.7% would give a return of 7.1%, which is well ahead of the fixed rate tranche.

And therein lies the challenge.

Anyone who thinks the market is pricing rates too high should go fixed and grab the rate on offer now. Anyone who thinks the market is correct or rates will go higher should go floating.

(Note this bond is available to wholesale investors only but that is a surprisingly large group of investors, as explained here).

Remember that for fixed rate investors, two risks can send prices down: either term interest rates rise or credit spreads widen, so such an investment should be part of a diversified portfolio.

For investors who cannot access wholesale bonds, NAB recently issued a new hybrid (ASX:NABPI) paying 3.15% above the 3-month bank bill rate. Again, based on a bank bill rate of 1.5%, the initial yield will be 4.65% buying at par or $100 (prices will vary when trading on the ASX). This hybrid has an expected life of 7.5 years (hybrid spreads have widened since the date of writing this article. See the Firstlinks Education Centre for weekly price updates from nabtrade).

But if measured against the 4.5% bank swap curve and 3.15% margin, this hybrid may earn 7.65% in future. The return is similar to the franked yield on NAB’s shares without the equity market risk, based on the previous experience that hybrids are significantly less volatile than bank shares at times of market shocks.

Beneath the simple exterior of a floating rate bond, bank hybrids are complicated instruments, including conversion to equity in certain circumstances, but Australian banks are extremely well capitalised.

Retail investors can also consider bond funds, bond ETFs and listed bonds, either in fixed or floating structures, so these opportunities are not restricted to wholesale investors. For a floating exposure, check the fund's fact sheet for a repricing duration of 90 days or less. For fixed rate, the duration is more likely five or more years.

Your fixed versus floating decision

The failure of the Reserve Bank Governor, Philip Lowe, and its Board, to foresee the rampant inflation of 2022 shows that even with the best information in the world, forecasts are a guess. Lowe repeatedly stated until six months ago that cash rates would not increase until 2024, but now the market expects cash rates over 3.5% by the end of 2022.

Former Reserve Bank Governor Ian Macfarlane recently stated that the inflation target of 2% to 3% will be difficult to achieve and is more likely to stay around 5%.

Adding to the uncertainty, despite US inflation hitting a 40-year high of 8.6% last week, Bloomberg writes that “Inflation is poised to ease according to these three indicators”. The three items are falling prices of computer chips, shipping containers and fertilisers, all key input to the manufacturing processes of thousands of companies and products.

Either way, nominal yields available to investors now can make a meaningful contribution to the income required to keep up with inflation, and cash and term deposits paying 1-2% have serious yield competition. Fixed or floating, or a bit of each, bonds are back in the game.

A further update from Warren Bird

In 2016, fixed interest expert Warren Bird wrote an article called "Are we going through a bond market route?". Here is a follow up with his thoughts on whether fixed rates are value at current levels.

"Over the last two years, since July 2020, US 10-year yields have risen from 0.55% to 3.43%. That's 2.88% over 23 months. We're seeing negative returns over the two-year period for the typical Australian bond fund of 10-15%. It's not necessarily over yet, of course, so the record bear market move in the US of 3.25% in 1987 is well within reach and could easily be exceeded.

The lunacy of central banks ignoring how their QE had turned into money supply growth in 2020-21, resulting in them not acting to contain inflation a year ago when it was obvious that it was going to be an issue, means that even at 3.4%, the US 10 year Treasury bond is paying a big negative real yield at the moment.

But it's not as negative as cash, so I expect that the big end of town will start to nibble at buying bonds and lengthening duration from here. Cautiously, I suspect, but if the central banks do start acting to reign in their monetary policy accommodation and get us back to a more slow and steady with inflation, then from a longer-term perspective, yields are just about at 'fair value' levels."


Graham Hand is Editor-At-Large for Firstlinks. This article is general information and does not consider the circumstances of any investor. Disclosure: Graham has invested in the fixed rate component of the Macquarie transaction and the floating hybrid of NAB, taking a bit each way in his diversified SMSF portfolio.


33 Comments
Dudley
June 19, 2022

"... our fund managers, bond brokers, etc buy and sell based on the yield to maturity. The price then gets calculated from that [yield].":

In other words, they start with a yield they will trade at then calculate the price they will bid or offer.

Excel function:
PRICE(settlement, maturity, rate, yld, redemption, frequency, [basis]);
https://support.microsoft.com/en-us/office/price-function-3ea9deac-8dfa-436f-a7c8-17ea02c21b0a
is a function to calculate bond prices.

Is PRICE() relevant to Indexed Bonds? Or inputs massaged to be relevant?

The yld parameter is mystifying me. My guess is the yield on a similar non-indexed bond. Can you enlighten?

Warren Bird
June 19, 2022

Hi again Dudley,

this is getting a bit off the track of the article, but I'll try to answer your questions.

1) not quite as you put it. Traders bid and offer in terms of yield, not price. Let's say a fund manager wants to purchase some 2050 Treasury Indexed Bonds. They will go to a couple of counterparties (brokers/ banks/
or a trading platform where several counterparties are active) and advise the face value they want to transact - they don't usually give away whether they're a buyer or seller. Each counterparty will then advise the yield at which they're willing to buy that amount and the yield at which they're willing to sell. Let's say they put up 2.05/1.95. The fund manager then has to decided if 1.95% is an acceptable yield or not. Of course if another broker says 2.07/1.97 then the fund manager will assess the higher yield, ruling out the lower offers.
Price is only calculated by the back office in order to work out how much the purchaser has to hand over in cash to the seller when the transaction settles.
(OK, it's more complicated than that in reality - and I haven't personally been involved in this activity for a decade now, so the technology has probably moved on a bit - but that's the gist. At the point of trading bonds, nominal or linkers, the price isn't part of the conversation to determine if the transaction happens or not.)

2) I am not aware of Excel having a price function for inflation linked bonds. You can't use the normal bond price function for linkers. I'm afraid that if you want to calculate the price yourself then you have to go through all the steps that the AOFM's formula requires.

Dudley
June 19, 2022

"bit off the track": Trading in Treasuries seems relevant - with indexed bonds will need sharp tools.

"Price is only calculated by the back office in order to work out how much the purchaser has to hand over in cash to the seller when the transaction settles.":

The Treasury bonds traded on ASX are quoted in $:
https://www2.asx.com.au/markets/trade-our-cash-market/equity-market-prices/bonds

When I transact through my broker on those indexed bonds, the order is specified in Quantity or $, not %.

It used to be that one could buy over the counter in RBA's shop. Not now - likely you were not involved with that. Now the bonds can be purchased through ASX.

Therefore, the calculation required is from bid / offer $ to yield% to maturity.

Do you know of a better method than through numerical iterative estimation?

Warren Bird
June 19, 2022

Dudley, as I said, you need the price and the volume of bonds being transacted for settlement to take place.

If you don't trust your broker to settle at the right price for the yield you want then I'd get a different broker. If you're transacting with someone through the ASX then the price will be right for the yield - and vice versa.

I note that the ASX has a bond price calculator in development. That might solve your time consuming problem.

Dudley
June 20, 2022

"need the price and the volume of bonds being transacted for settlement to take place":

To transact, my broker (ANZ) requires from me an order specifying price and quantity of these bonds:
https://www2.asx.com.au/markets/trade-our-cash-market/equity-market-prices/bonds
My broker does not take orders specifying the yield% - just as it does not take orders for units or shares by specifying dividend yield%.

I imagine your share broker operates similarly.

To determine whether the price is right I need to estimate the $ or % yield - to compare other options such as shares, units or other bonds.

"the ASX has a bond price calculator in development": been that way for a long time. Possibly not a profit centre for ASX.

Warren Bird
June 20, 2022

Hello Dudley, can't help you there, I'm afraid. Maybe you should talk to the ASX. If I were to purchase some listed inflation-linked bonds it would be in the platform that I use for my SMSF and all I do is enter how much I want to invest. The system works out how many units of the security that will be based upon the current offer price on the ASX and when I hit ''submit'' it just happens. If I wasn't happy with the pricing that this implies - I'd have worked out, like you, what price equates to the yield at which I want to acquire the investment - I'd pull the transaction before submitting. If you think the process with your broker is cumbersome, I'd have a chat with them. I'm sure that ANZ would have resources available from their capital markets area if you asked. I agree that the ASX doesn't provide enough information, though. Their 20 minute delayed 'free' pricing page doesn't show the yield. https://www2.asx.com.au/markets/trade-our-cash-market/equity-market-prices/bonds

Dudley
June 21, 2022

"can't help you there":

I found an answer: layout the investment, coupon and maturity returns by date in today's (real) value and calculate the XIRR (internal rate of return by date). Results are close to that calculated by YIELD after normalising inputs as before.

Currently real yield is near to negligible due to market value being greater than nominal (CPI adjusted) value. So good for inflation hedge buy not for growing wealth.

Warren Bird
June 21, 2022

Dudley, you said: "Currently real yield is near to negligible due to market value being greater than nominal (CPI adjusted) value. So good for inflation hedge buy not for growing wealth."

That is a misunderstanding of how the mathematical dynamics of these bonds are working. Apart from your statement being highly dependent upon which specific bond your are looking at - there are quite a few where the market value is well below the nominal value - it's simply not true that comparing market and nominal values tells you what the real yield is. It's part of the story, but not all of it and what you are leaving out is critical.

Let me illustrate by looking at a security that does meet your description - the Treasury Index Bond maturing in Sept 2030. This has a nominal value at present of 129.46 but a market value of 138.

The coupon real rate on that bond is 2.5%. Which means that it will pay one quarter of 2.5% of 129.46 in interest in September. That is 0.809125. That amount is 2.3% per annum of the current purchase price of 138. However, you do face negative amortisation. For argument's sake, let's say there is zero inflation over the next 8 years so the 2030 bond matures at 129.46. You will "lose" 8.54 over the next 8 years, or 1.0675 a year. That is 0.8% of 138. So the net annual return you get is 2.3 minus 0.8 = 1.5%.

That is the real yield on this security. (approximately, but close.)

At just about any level of real yield, I wouldn't consider that inflation-linked bonds are a wealth builder! They are a real wealth and real income protector. But if you're worried about inflation over the next 8 years and want to lock in a return of 1.5% plus inflation for that period, then the Australian ILB number 408 will do that for you.

I hope all this helps you and others understand an asset that has, I think, become worth thinking about for the first time in quite a while.

Tony Dillon
June 21, 2022

Hi Dudley, have you tried the excel function Goal Seek?

Consider first, the indexed bonds pricing formula first at https://www.aofm.gov.au/securities/treasury-indexed-bonds

This consists of two components. The indexation factor is the bit (as best as fonts will allow me here): (Kt(1+ p/100)^(-f/d))/100

This component is independent of yield and equals 1.07208 in the example given.

It is an indexation multiple on the rest of the formula, which I won’t attempt to type out without proper fonts, which is the bond price without indexation, and is basically your excel PRICE() function. I say ‘basically’, and I’ll come back to that.

The bond price component equals 123.90365 (if you work through the formula, which is discounted cashflow maths and notation). And 123.90365 x 1.07208 = 132.835, as in the example.

If you do this in excel cells:

A1 = 15/9/19
A2 = 21/8/40
A3 = 1.25%
A4 = 0.10%
A5 = 100
A6 = 4
A7 = 0

Then PRICE(A1,A2,A3,A4,A5,A6,A7) = 123.8202 (put this in say cell A9). Then multiply that by 1.07208 to get your indexed bond price (cell A10).

Note A9 differs from the bond price component above of 123.90365 by 0.084. Curiously, PRICE() deducts a portion of the coupon according to how far away the settlement date is away from the coupon date. The (quarterly) coupon date prior to the settlement date (15/9/19) was 21/8/19. Which was 25 days ago. So PRICE() deducts (25/92) x (1.25/4) = 0.0849. Not sure why it does this, but when the coupon is small it doesn’t affect things too much. And which is why I prefer to do my own formularised calcs in excel as opposed to using packaged functions (and how I spotted the difference), so there are no surprises, and I can see exactly what’s happening with the numbers. Anyway, for your purposes, PRICE() is fine.

Back to Goal Seek.
1.On the Data tab, in the Data Tools group, click What-If Analysis, and then click Goal Seek.
2. In the Set cell box, enter the reference for the cell that contains the formula that you want to resolve (in your case, the indexed bond price in A10).
3. In the To value box, type the formula result that you want (say 120).
4. In the By changing cell box, enter the reference for the cell that contains the value that you want to adjust (the yield A4). So a price of 120 will give a yield here of 0.64% (remembering it is a ‘real’ yield here).

So Goal Seek allows you to set a price and determine a yield for this indexed bond. And vice-versa, you can set any yield in A4 to determine a price. You can change the parameters in cells A1 to A7 according to what you want to price.

Hope this helps.

Warren Bird
June 21, 2022

Tony, yes that works. Very helpful.

So for the 2030 linker that I used in my most recent example for Dudley, the price of 138 gives a real yield of 1.42%.

Dudley
June 21, 2022

Tony Dillon: A4, 'yld'; why 0.10%? What is it and whence forth cometh it? ( SOLVER is an alternative to GOAL )

Warren Bird: My XIRR method using your inputs results in 1.4195046% real yield = your result 1.42% ?

A single function would be ideal.

YIELD assumes maturity date = last coupon date, which is not true for Comm Index Bonds - but returns a value close to the XIRR method where maturity date > last coupon date.

Tony Dillon
June 22, 2022

Good to hear Warren.

Dudley, the 0.1% real yield to maturity, is just as per the worked example in: https://www.aofm.gov.au/securities/treasury-indexed-bonds.

It was an input into the formula that gave the price of 132.835

Dudley
June 22, 2022

"the 0.1% real yield to maturity":

Ta, as Warren explained, there was / is a market where bid and offers are in real yields, hence the need for an function to calculate price.

However, on ASX the bid and offer are in price hence the need for a function to calculate real yield.

The Excel YIELD function with prices normalised to 100 provides an good enough approximation to real yield and requires only the function parameter list and is thus convenient in a table of bonds.

The XIRR function using a table of dates and corresponding principal and coupon amounts provides much better approximation but inconveniently requires said table.

The GOAL seeking solution has similar drawback of requiring a table of parameters for each bond.

However, we can see how to calculate yield from price.

When to use Indexed Bonds? Capital Gains Tax on imaginary / inflationary / nominal yield and negligible real yield means Indexed Bonds are best kept in a Capital Gains Tax free environment - not nice paying tax on a large amount in a single year for amounts accumulated over many years.

Steve
June 16, 2022

Hypothetically lets consider if central banks and govts did nothing during the pandemic. With people laid off work and lockdowns, we would have had a depression about 5 minutes. So, was the additional spending actually inflationary (meaning excessive over the economy capacity) or did they just manage to fill a bloody great hole and hold the ship steady? It's not the same as adding $200 billion to a normal economy, it was adding $200 billion to an economy that was about to lose $200 billion of output. Take away Chinas obsession with covid and lockdowns, supply chain issues from covid and a little spat in Europe impacting energy prices and some floods affecting food prices, where would inflation be now?
Interest rates had to get somewhere closer to normal. Expecting depositors to accept a pittance for their money was never a long term option.

Warren Bird
June 16, 2022

Well, Steve, I have to say that I reckon in the US it would be around 5-6% without those factors. That's what I had in mind in late 2020 when I first provided my thoughts on what the money supply growth we were seeing was portending. That was before supply chain issues emerged during 2022. Supply chain is a factor, but demand and money supply growth is at least just as significant.

michael
June 18, 2022

It can do both, of course.
filling a hole for years 1 & 2.
Inflationary in years 2,3,4...

AlanB
June 16, 2022

Thanks for another great article. I learn more on this forum than any other.
Fixed or floating?
Take two bonds.
Fixed rate Equity Trustees Ltd (YTMMQ1) bought today at $100 pays $4.15pa, so 4.15% into the future.
Floating note Macquarie Group Ltd Capital Notes 3 (MQGPC) bought today at $100.49 pays a margin of 4% on top of the bank bill swap rate of 1.7%, so 5.7%.
However, interest rates are rising so the floating note MQGPC will pay more than 5.7% each time the BBSR rises.
The floating note would seem to be a far better investment than the fixed rate when interest rates are rising.

As interest rates rise fixed rate bonds prices should decline and floating rate bond prices should rise, reflecting the improving yields of floating over fixed rate bonds.
But currently I see fixed and floating note bonds all dropping in price. Floating rate MQGPC has fallen by 6% and fixed rate YTMMQ1 by 13% over the last 12m.
It seems both fixed and floating rate bonds are being sold off in the general rush to liquidate shares, so floating note bonds/notes now represent an even better buying opportunity. I have my eye on some which are looking more tempting every day.

Graham Hand
June 16, 2022

Hi AlanB Yes, I am also perplexed by this price fall in floating instruments. Given the market expects rates to rise significantly, (a margin of 4% might take the payment to 8%), why is there not more demand? Elstree, who specialise in hybrids, give this reason: "The drivers this month were expectations of a new hybrid issue (and speculation about a second issue in the near future), some selling from one broker that indicates an investor/allocator moving out of the sector and negative equity markets." While this is not advice, sounds like an opportunity.

Warren Bird
June 16, 2022

The issue is that most floaters have credit risk. When credit spreads get wider (as they have been ) then the floaters will be revalued using a bigger margin over bank bill, which means a lower price. The longer term, the more credit duration risk there is and the larger the price fall.
I had this argument on LinkedIn with a provider of private debt fund investments, which are floating rate, when he argued they were "inflation proof". I don't believe they are because as policy is tightened to fight off inflation you tend to get wider spreads. Yes, the coupon interest they pay will go up as the benchmark rate goes up, but there is also a capital hit when credit risk is affected.

Colin Edwards
June 18, 2022

Not such an opportunity for small investors!. Locked out of new hybrid capital notes issues, by ASIC ruling that you have to be a "professional"or wholesale investor. Scandalous rorting of the financial system if you ask me!

Graeme
June 15, 2022

I guess I'm getting old, but my head spins when I start reading about swap rates. I've yet to figure out why they even exist. What I do know, however, is that a mate asked about NABPI at his local NAB branch and was directed towards a five year term deposit yielding around 2%. Seems the 'retail' end is getting screwed once again.

SMSF Trustee
June 15, 2022

Not if you buy government bonds on the ASX. They're paying from 3% for 2 years to just over 4% for 10 years.
Banks are being very tardy on TD's I agree.

Graham Hand
June 18, 2022

Colin and Graeme, I agree the restriction on access to new hybrid issues is a poor ruling, but if you check our Education Centre, we include a weekly report from nabtrade with nearly all the existing listed hybrids. Available to anyone who can buy shares on the ASX and expected returns to first call over 8% for major bank names. Not advising, just observing. https://www.firstlinks.com.au/uploads/2022/reports/NAB_ASX_Listed_Bond_Hybrid_Rate_Sheet_15_Jun_2022.pdf

O
June 15, 2022

“The lunacy of central banks ignoring how their QE had turned into money supply growth in 2020-21, resulting in them not acting to contain inflation a year ago when it was obvious that it was going to be an issue, means that even at 3.4%, the US 10 year Treasury bond is paying a big negative real yield at the moment.” I’m sorry, but there’s no evidence that QE is inflationary. You’re conflating QE with monetary financing, which it is not. The current inflation was not caused by ‘money printing’, it was caused by pandemic related snarls in supply chains and a war.

Warren Bird
June 15, 2022

O, I am most certainly not doing that.
I have often written that QE is not "printing money", including in a primer on QE that I wrote for this newsletter many years ago. But QE has the potential to become the source of money supply growth if the banks lend it rather than recycle it back to their central banks
After the GFC most of the QE didn't result in money creation. It did help prevent a complete collapse in broad money, but mostly it ended up as large bank deposits at the Fed. That's why predictions of inflation at the time didn't come about - lots of folk predicted it because they confused QE with "money printing".
However, what we saw in 2020 with the pandemic-driven QE was that banks did use it to create credit. This was showing demand strength in the economy that meant that QE turned into a significant rise in money supply growth. I said at the end of 2020 in my various professional contexts that inflation would become an issue as there was now "too much money". That's exactly what has happened.
It's a myth that it's just supply chain disruptions. Yes, supply chains have been disrupted, but the only way that can turn into inflation is if demand remains strong and people are willing & able to pay the higher prices, or if they have to (e.g. essential food items). Fixing the supply chain issues should be part of the package of policy responses, but the demand side of the demand-supply imbalance has to be addressed too. Government spending (fiscal policy) and interest rates (monetary policy) both need to be tighter.
Money supply growth took off in 2020 and we are now seeing the obvious, inevitable inflation consequences. Central Banks should have seen this coming - some of us did, including Prof Tim Congdon in this newsletter in April 2020 and again in a second article in 2021.

CC
June 15, 2022

Obviously interest rates are going higher.
You'd be crazy to buy fixed rate bonds in this environment

Warren Bird
June 15, 2022

CC, the decision you have to make is whether the bond market has already priced in those increases in short term rates. At just over 4% yield, is the Australian government 10 year bond already paying the likely average cash rate over the next 10 years plus a term premium? If so, then why not buy 10 year bonds on a 10 year view? If you don't take a 10 year view on a 10 year bond then good luck to you. You might be right that yields go a bit higher as the cash rate increases, but then again you might be missing out on a chance. I remember how few people bought 10 year bonds in 1995 at 10% because they thought the cash rate might keep going a bit higher. They missed the last great chance to grab long term value in the local bond market because they took a 3 month view on a 10 year asset instead of looking at the longer term. I'm not necessarily convinced that 4% is the right level, but I think it's getting close. And at the very least you have to give it deeper thought than your throwaway comment does!

Graham Hand
June 15, 2022

CC, the point is not whether cash rates go higher from this point, as we know they will. The point is whether fixed rates have already allowed for the coming rises, or indeed, gone too high. This is the opportunity. At some point, they are a buy. I don't think it's crazy to lock in 6% for 10 years on a quality bond as part of your overall portfolio.

Dudley
June 17, 2022

Warren, Graham; What about Treasury Inflation Indexed Bonds?

My calculations show negative real yields as the market prices are currently larger than the (CPI adjusted) Nominal Value.

For some, a few percent over inflation is all that is required.

Warren Bird
June 18, 2022

Dudley,

Australian government inflation linked bonds are trading at positive real yields. Longer term securities are at about 2% real yield, according to the RBA's daily data base. Those are the highest real yields since 2014.

Align that with the nominal bonds trading just over 4% and you can see that the market is pricing for inflation to average around 2% over the long term. Of course, as long as inflation is above that level an investor is getting regular cash payments that reflect the higher rate of CPI inflation.

Not a recommendation to invest in them, but a return of 2% plus inflation from a government security is worth a look, don't you think, for the conservative part of your portfolio?

Dudley
June 18, 2022

"Longer term securities are at about 2% real yield, according to the RBA's daily data base.":

Here:
Indicative Mid Rates of Australian Government Securities – F16
https://www.rba.gov.au/statistics/tables/xls/f16.xls
Cell AS883 = 2.020% ( "Treasury Indexed Bond 415 1.00% 21-Feb-2050" )

Would be most grateful if you would show us how that rate is calculated.

From https://www.aofm.gov.au/media/651
"CAIN415 1.00%" for 21-Aug-2022: Kt = 109.14, p = 1.75

Pricing formulae here:
https://www.aofm.gov.au/securities/treasury-indexed-bonds

[ I took a normalising, simplifying, route by assuming maturity payout is 100 (Future Value), and the Present Value is equal to the Market Value / Nominal (CPI adjusted) Value Kt * 100. I used the YIELD spreadsheet function to calculate the yield%. ]

"a return of 2% plus inflation from a government security is worth a look, don't you think, for the conservative part of your portfolio?"

For me, $1M yielding 2% indexed maturing around 2035 would be useful as 'insurance' for my aged care.

Warren Bird
June 19, 2022

Dudley,
your 1st question, 'how is the rate {of 2.02%} calculated?' Well, that doesn't need to be calculated - it's where the bonds have traded in the market. (In Australia we don't tend to trade bonds off their price like in the US, but our fund managers, bond brokers, etc buy and sell based on the yield to maturity. The price then gets calculated from that.)

The trick with inflation-linked bond price calculations is that the maturity value is not $100, as is the case with nominal bonds. The maturity value escalates with the inflation rate. So, for example, in the AOFM table that you linked to, if you look at the recently matured CAIN409 (Commonwealth of Australia Indexed bond issue #409). When it matured in February this year it paid investors $119.84 for every $100 of bond 'face value'. This reflected the rise in the CPI over the time between issue and maturity - prices had gone up by 19.84% so the value of the bond had gone up by that much as well. That's how they provide protection against inflation for your capital over the life of the security. Also, the regular interest payment (the ''coupon'') is calculated as a % of the indexed value of the bond, not as a % of the original face value. So the income goes up with inflation as well.

The market price relative to that adjusted face value reflects the difference between the coupon yield and the current market yield. So to go back to the CAIN415 you mentioned, it is a bond that doesn't mature until 2050. It currently has an indexed face value of $109.14. It's coupon is only 1%, so it's going to pay holders in August this year an amount of $1.0914 instead of just $1.00. But in the market, it's been trading at 2% real yield. So the market price is much lower than $109.14 because there's another 1% per year of income that has to be provided. That happens through discounting the purchase price so that the capital value can amortise over the next 28 years until it matures.

So if you buy that 2050 Treasury Indexed Bond (eg on the ASX) your total return over the next 28 years will be 2% plus inflation. You'll get that through capital protection of the face value being indexed with the CPI, plus a regular cash flow that's 1% per year of the indexed value, plus a non-cash flow component as the bond amortises up from the purchase price to the eventual indexed maturity value in 2050.

The market price can fluctuate and may well fall further if the traded real yield increases further. (At 2% it's higher than it has been in ages.) That won't change any of the return contributors to maturity that I summarised above, but if you needed some capital and had to sell the bond before maturity you might incur a capital loss. But I reckon that over the long haul, a real return on a government guaranteed security of 2% isn't too bad.

Dudley
June 19, 2022

"... our fund managers, bond brokers, etc buy and sell based on the yield to maturity. The price then gets calculated from that [yield].":

In other words, they start with a yield they will trade at then calculate the price they will bid or offer.

Excel function:
PRICE(settlement, maturity, rate, yld, redemption, frequency, [basis]);
https://support.microsoft.com/en-us/office/price-function-3ea9deac-8dfa-436f-a7c8-17ea02c21b0a
is a function to calculate bond prices.

Is PRICE() relevant to Indexed Bonds? Or inputs massaged to be relevant?

The yld parameter is mystifying me. My guess is the yield on a similar non-indexed bond. Can you enlighten?


Leave a Comment:

RELATED ARTICLES

Which asset class in Australia offers the best value now?

Are A-REITs set for a comeback?

Why we believe bonds are now beautiful

banner

Most viewed in recent weeks

2024/25 super thresholds – key changes and implications

The ATO has released all the superannuation rates and thresholds that will apply from 1 July 2024. Here's what’s changing and what’s not, and some key considerations and opportunities in the lead up to 30 June and beyond.

Five months on from cancer diagnosis

Life has radically shifted with my brain cancer, and I don’t know if it will ever be the same again. After decades of writing and a dozen years with Firstlinks, I still want to contribute, but exactly how and when I do that is unclear.

Is Australia ready for its population growth over the next decade?

Australia will have 3.7 million more people in a decade's time, though the growth won't be evenly distributed. Over 85s will see the fastest growth, while the number of younger people will barely rise. 

Welcome to Firstlinks Edition 552 with weekend update

Being rich is having a high-paying job and accumulating fancy houses and cars, while being wealthy is owning assets that provide passive income, as well as freedom and flexibility. Knowing the difference can reframe your life.

  • 21 March 2024

Why LICs may be close to bottoming

Investor disgust, consolidation, de-listings, price discounts, activist investors entering - it’s what typically happens at business cycle troughs, and it’s happening to LICs now. That may present a potential opportunity.

The public servants demanding $3m super tax exemption

The $3 million super tax will capture retired, and soon to retire, public servants and politicians who are members of defined benefit superannuation schemes. Lobbying efforts for exemptions to the tax are intensifying.

Latest Updates

Retirement

Uncomfortable truths: The real cost of living in retirement

How useful are the retirement savings and spending targets put out by various groups such as ASFA? Not very, and it's reducing the ability of ordinary retirees to fully understand their retirement income options.

Shares

On the virtue of owning wonderful businesses like CBA

The US market has pummelled Australia's over the past 16 years and for good reason: it has some incredible businesses. Australia does too, but if you want to enjoy US-type returns, you need to know where to look.

Investment strategies

Why bank hybrids are being priced at a premium

As long as the banks have no desire to pay up for term deposit funding - which looks likely for a while yet - investors will continue to pay a premium for the higher yielding, but riskier hybrid instrument.

Investment strategies

The Magnificent Seven's dominance poses ever-growing risks

The rise of the Magnificent Seven and their large weighting in US indices has led to debate about concentration risk in markets. Whatever your view, the crowding into these stocks poses several challenges for global investors.

Strategy

Wealth is more than a number

Money can bolster our joy in real ways. However, if we relentlessly chase wealth at the expense of other facets of well-being, history and science both teach us that it will lead to a hollowing out of life.

The copper bull market may have years to run

The copper market is barrelling towards a significant deficit and price surge over the next few decades that investors should not discount when looking at the potential for artificial intelligence and renewable energy.

Property

Global REITs are on sale

Global REITs have been out of favour for some time. While office remains a concern, the rest of the sector is in good shape and offers compelling value, with many REITs trading below underlying asset replacement costs.

Sponsors

Alliances

© 2024 Morningstar, Inc. All rights reserved.

Disclaimer
The data, research and opinions provided here are for information purposes; are not an offer to buy or sell a security; and are not warranted to be correct, complete or accurate. Morningstar, its affiliates, and third-party content providers are not responsible for any investment decisions, damages or losses resulting from, or related to, the data and analyses or their use. To the extent any content is general advice, it has been prepared for clients of Morningstar Australasia Pty Ltd (ABN: 95 090 665 544, AFSL: 240892), without reference to your financial objectives, situation or needs. For more information refer to our Financial Services Guide. You should consider the advice in light of these matters and if applicable, the relevant Product Disclosure Statement before making any decision to invest. Past performance does not necessarily indicate a financial product’s future performance. To obtain advice tailored to your situation, contact a professional financial adviser. Articles are current as at date of publication.
This website contains information and opinions provided by third parties. Inclusion of this information does not necessarily represent Morningstar’s positions, strategies or opinions and should not be considered an endorsement by Morningstar.