The ability to forecast market or stock returns is a holy grail in investment management. The search has captivated industry and academia. Many smart people have devoted their careers to the search, large teams of highly talented people have been assembled, and elaborate models have been developed. We have even seen examples of such work in Cuffelinks! Many of these endeavours have failed, sometimes spectacularly.
And yet so many are tempted to continue in their quest to develop a model or process for predicting market returns. It appears to me that the desire for precision, to be close to exact in one’s forecasts, often contributes to the downfall of people taking on this quest.
If we step back to a higher, less specific view, take on board key messages (for example that markets appear cheap or expensive), diversify appropriately, and invest for the long term (with a matched frame of mind for assessing outcomes) then the world of managing a portfolio becomes a simpler and less high-stakes exercise.
Models and processes for forecasting markets generally fall into two broad categories:
- fundamental – where one considers the economic (market) or financial (company) prospects and estimates the value of these prospects in the context of current market prices
- technical – where one solely looks at past price data in search of patterns that may repeat in the future. Common examples include trend following and mean reversion.
It is common to see both techniques used together. It doesn't matter whether the process is fundamental or technical; the same problems apply when we search for the exact model.
Here’s where the squiggly lines come in. You can try this exercise yourself.
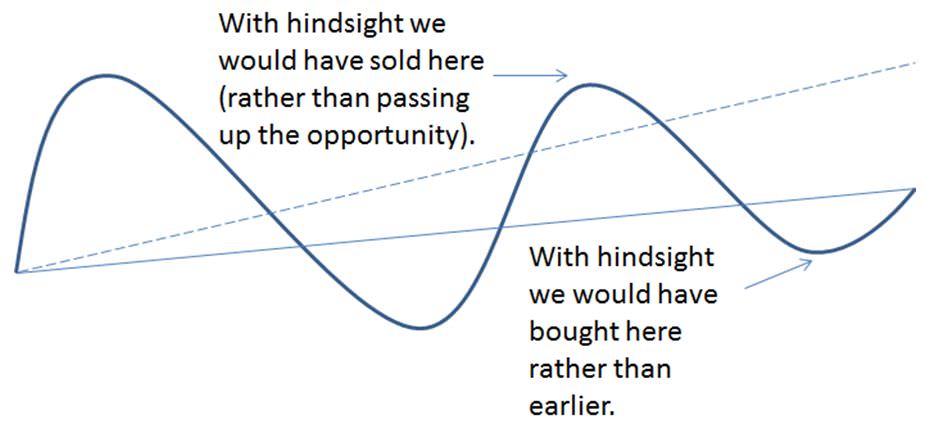
1. Draw a squiggly line which represents the movement of a stock price or market index through time. Connect the start and end points of the squiggle with a straight line.
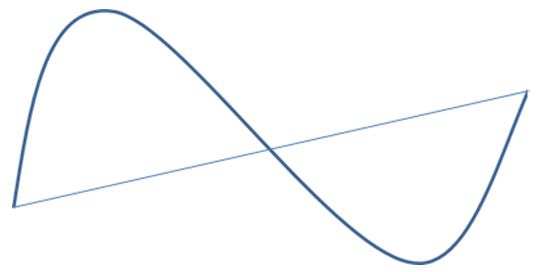
One might be tempted to look at the straight line and observe that it summarises the trend movement in the market. It might appear logical to say with hindsight, “there are clear buy and sell opportunities”. It might lead to a trading rule: when the price is a long way above or below my trend line, I will sell or buy.
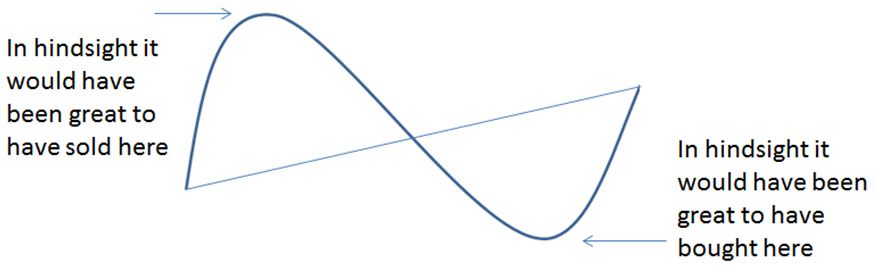
The example above could be something as simple as an expectation that equity returns will annualise 8% p.a. If they run too far ahead or behind this level then this is an opportunity to sell or buy.
2. Continue your squiggly line a little further into the future and extend the straight line derived in the previous example.
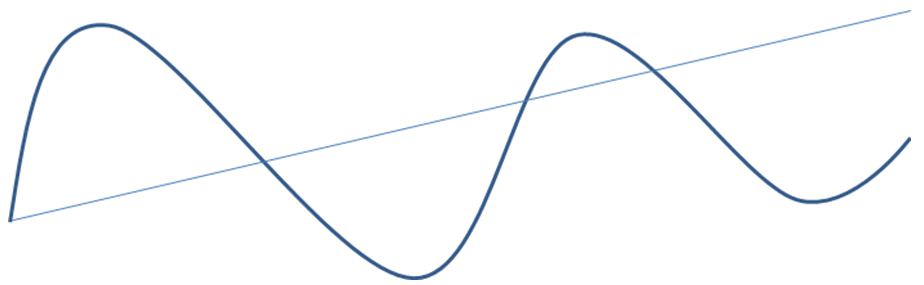
3. Let’s assume we follow our little trading rule developed in step 1 into the future.
In the case of my diagrams above (yours would be different of course but you likely experienced less-than-perfect outcomes as well), it looks like our little timing model didn’t work too well.
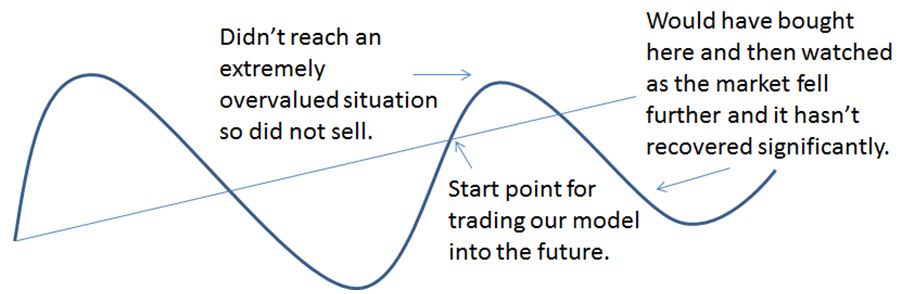
On reflection we may begin to realise that the opportunities identified in the second diagram are only available to people in possession of a time machine. It is only with hindsight that we can observe this historical relationship. The fallacy is to bet on this relationship continuing exactly in to the future.
4. Because we now have more market observations perhaps we should review our model. We find the slope of our line (which explains the relationship) has changed (become flatter in this case – the new line below is unbroken and the original line is dashed). With perfect hindsight we would have traded differently.
The fact that the slope changes as we progress through time is the downfall of this type of approach, and indeed any approach that looks backwards. It is easy to say “history doesn’t repeat but it does rhyme” but simple analysis like this highlights that what we may have is an off rhyme.
Indeed it is risky to assume that there are any precise permanent relationships in finance. Even something like the equity risk premium has changed significantly through time and can be affected in uncertain ways by many externalities such as demographics, technology, politics and environment.
Technically the slope in our diagram is known as a parameter in a forecasting model. The fact that the slope can change through time and that we do not know the true value of the slope is called parameter uncertainty. Assuming a parameter or a relationship is stable when in fact it may evolve through time is dangerous. This uncertainty is everywhere but not really well considered when constructing diversified portfolios. For instance, is the equity risk premium 4%, 6% or 8%? Is it even appropriate to assume it is constant over the long term?
There has been much academic and industry research demonstrating that if we are uncertain of the true values of a parameter (the slope in this instance) we should allocate less to this investment opportunity ie. it is sensible to diversify.
It is possible to extend the findings of this example to more complex models in which multiple variables are used to describe market performance. A common example is the use of dividend yields to forecast market or individual stock returns. The more factors we have the greater the number of model parameters and the greater the number of sources of parameter uncertainty.
What are the lessons?
So what lessons should we pull out from this collection of squiggly lines?
- History is just that and could be far from an accurate forecast of the future.
- There are however valuable observations and lessons to be drawn from history.
- Any model based on an historical relationship would have worked perfectly in hindsight. But we don’t have a time machine and we are not bestowed with perfect foresight.
- Once we acknowledge the uncertainties introduced in forecasting markets it is easy to understand why it remains sensible to diversify and take a long-term outlook.
No one knows precisely which way markets or individual stocks will perform. The best we can do is to research deeply and tilt the odds in our favour, especially over the longer term. In searching for precision we may actually construct portfolios which subsequently disappoint. These are valuable lessons for selecting managed funds and constructing portfolios.
David Bell’s independent advisory business is St Davids Rd Advisory. In July 2014, David will cease consulting and become the Chief Investment Officer at AUSCOAL Super. He is also working towards a PhD at University of NSW.