Register For Our Mailing List

Register to receive our free weekly newsletter including editorials.

Home / 403

The fascinating bank hybrid journey of the last year

This time last year we were scrambling to figure out how best to explain the hybrid market’s performance. From 2 March 2020 to the close of business on 23 March 2020 the broader market, as represented by Elstree Hybrid Index declined by a material 15.7%. By the month’s end the index had managed to claw its way back such that it was down, over the month, by a relatively pedestrian 6.2%.  

Wow, that was some 12-month period!

On the 12-month anniversary of the biggest drawdown since the GFC, it's an interesting time to reflect.

Most risk markets, hybrid markets included, bottomed on or around 23 March before rallying strongly on coordinated government and central bank intervention. The rally that ensued produced extraordinary return outcomes – we might even go so far as to say ‘ridiculous’ return outcomes.

Over the year to end 31 March 2021 the hybrid market as represented by the Elstree Hybrid Index returned 13.32%. This compares (now) with an expected hybrid market return of cash +3% (i.e. 3%). Investors certainly should not expect those hyper-inflated return outcomes again any time soon. The chart below shows the returns on individual hybrids (vertical axis) and the standard deviation (horizontal axis). We’ve also shown the Elstree Hybrid and All Ordinaries Accumulation indices.

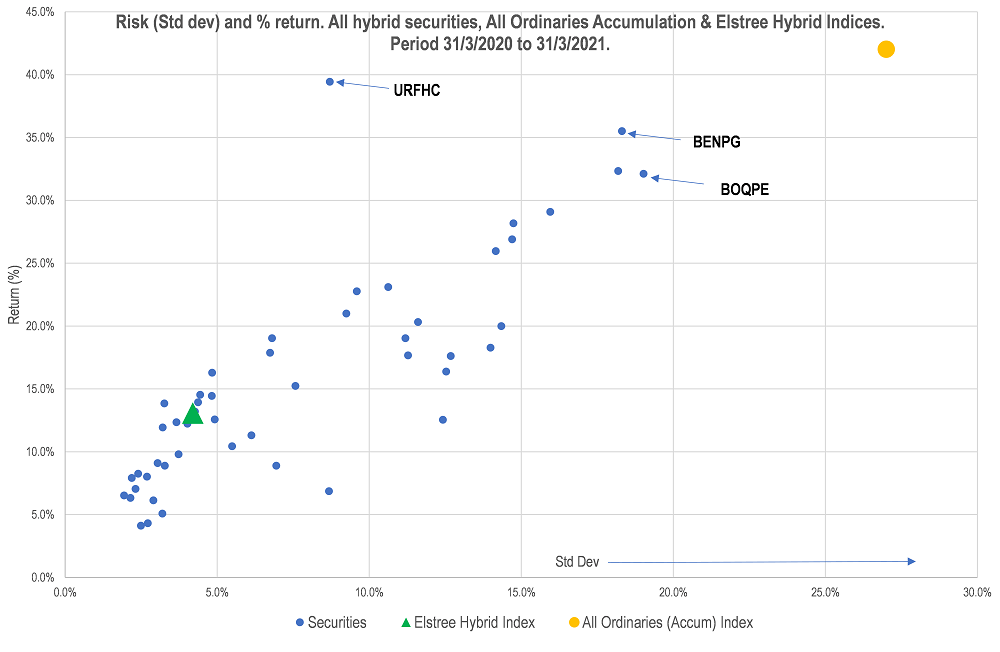
What does this tell us?

  • Almost everything did well but the non-major bank hybrids did best with many producing around 30% returns.
  • Volatility was relatively subdued given the return outcomes. Pretty much everything went up in a straight line.
  • If you produced the same chart but started it at 28 February 2020, you would get different outcomes with hybrids still producing an acceptable return and risk profile with equities displaying more risk and less return.

What were the fascinating days?

  • The hybrid market’s worst day was a -6.1% decline on 23 March 2020. This was the day that the NAB announced that they were converting their maturing NABPB hybrid into shares via a VWAP (Volume Weighted Average Price) agreement with UBS. This ‘option’ is present in almost every hybrid document and it allows the issuer to raise $1-$2 billion of equity capital without the usual complexities. In this instance investors received their $100 (for the note) and then the NAB ‘on sells’ the note to UBS and NAB then issues ordinary shares to UBS. The market erroneously interpreted the cleansing statement issued by NAB to mean that the maturing NABPB holders would not get $100 and instead would receive NAB shares at an estimated 30% premium to the last traded price. Investors sold everything including equities. NABHA fell 12%, AMPPB fell 11% while the broader equity market declined by just under 6%.
  • The hybrid market’s best day was a mere two days later on 25 March 2020 resulting in a 3.8% return. This was the day investors realised they had sold for the wrong reasons and bought back the stocks they had sold. The market had a net gain of 3.9% for that week.

Probably the biggest lesson is that many investors don’t understand the structures, and in a crisis, everyone panics first and thinks later.


Campbell Dawson is an Executive Director of Elstree Investment Management, a boutique fixed income fund manager. The Elstree Enhanced Income Fund delivered 18.7% in the 12 months to end March 2021. This article is general information and does not consider the circumstances of any individual investor.


RELATED ARTICLES

What now for SMSFs and hybrids?

Hybrids alongside corporate bonds a good balance

How are high net worths investing and thinking now?

banner

Most viewed in recent weeks

The case for the $3 million super tax

The Government's proposed tax has copped a lot of flack though I think it's a reasonable approach to improve the long-term sustainability of superannuation and the retirement income system. Here’s why.

7 examples of how the new super tax will be calculated

You've no doubt heard about Division 296. These case studies show what people at various levels above the $3 million threshold might need to pay the ATO, with examples ranging from under $500 to more than $35,000.

The revolt against Baby Boomer wealth

The $3m super tax could be put down to the Government needing money and the wealthy being easy targets. It’s deeper than that though and this looks at the factors behind the policy and why more taxes on the wealthy are coming.

Meg on SMSFs: Withdrawing assets ahead of the $3m super tax

The super tax has caused an almighty scuffle, but for SMSFs impacted by the proposed tax, a big question remains: what should they do now? Here are ideas for those wanting to withdraw money from their SMSF.

The super tax and the defined benefits scandal

Australia's superannuation inequities date back to poor decisions made by Parliament two decades ago. If super for the wealthy needs resetting, so too does the defined benefits schemes for our public servants.

Are franking credits hurting Australia’s economy?

Business investment and per capita GDP have languished over the past decade and the Labor Government is conducting inquiries to find out why. Franking credits should be part of the debate about our stalling economy.

Latest Updates

Superannuation

Here's what should replace the $3 million super tax

With Div. 296 looming, is there a smarter way to tax superannuation? This proposes a fairer, income-linked alternative that respects compounding, ensures predictability, and avoids taxing unrealised capital gains. 

Superannuation

Less than 1% of wealthy families will struggle to pay super tax: study

An ANU study has found that families with at least one super balance over $3 million have average wealth exceeding $19 million - suggesting most are well placed to absorb taxes on unrealised capital gains.   

Superannuation

Are SMSFs getting too much of a free ride?

SMSFs have managed to match, or even outperform, larger super funds despite adopting more conservative investment strategies. This looks at how they've done it - and the potential policy implications.  

Property

A developer's take on Australia's housing issues

Stockland’s development chief discusses supply constraints, government initiatives and the impact of Japanese-owned homebuilders on the industry. He also talks of green shoots in a troubled property market.

Economy

Lessons from 100 years of growing US debt

As the US debt ceiling looms, the usual warnings about a potential crash in bond and equity markets have started to appear. Investors can take confidence from history but should keep an eye on two main indicators.

Investment strategies

Investors might be paying too much for familiarity

US mega-cap tech stocks have dominated recent returns - but is familiarity distorting judgement? Like the Monty Hall problem, investing success often comes from switching when it feels hardest to do so.

Latest from Morningstar

A winning investment strategy sitting right under your nose

How does a strategy built around systematically buying-and-holding a basket of the market's biggest losers perform? It turns out pretty well, so why don't more investors do it?

Sponsors

Alliances

© 2025 Morningstar, Inc. All rights reserved.

Disclaimer
The data, research and opinions provided here are for information purposes; are not an offer to buy or sell a security; and are not warranted to be correct, complete or accurate. Morningstar, its affiliates, and third-party content providers are not responsible for any investment decisions, damages or losses resulting from, or related to, the data and analyses or their use. To the extent any content is general advice, it has been prepared for clients of Morningstar Australasia Pty Ltd (ABN: 95 090 665 544, AFSL: 240892), without reference to your financial objectives, situation or needs. For more information refer to our Financial Services Guide. You should consider the advice in light of these matters and if applicable, the relevant Product Disclosure Statement before making any decision to invest. Past performance does not necessarily indicate a financial product’s future performance. To obtain advice tailored to your situation, contact a professional financial adviser. Articles are current as at date of publication.
This website contains information and opinions provided by third parties. Inclusion of this information does not necessarily represent Morningstar’s positions, strategies or opinions and should not be considered an endorsement by Morningstar.