For much of the past decade, the profit results for the banks were rather simple to analyse. Coming out of the GFC, the major trading banks steadily grew profitability on the back of solid credit growth, declining bad debt charges and reduced competition as foreign competitors either exited the Australian market or were taken over.
This changed with the Financial Services Royal Commission in 2018, which had bank executives wringing their hands over remediation provisions and increased compliance costs during the profit results presented in 2018 and 2019. After CBA's solid result in February 2020, this year was seen as the year when banking got back to normal.
How wrong we were. I suspect that bank management teams would prefer the stern gaze of Commissioner Hayne to wondering whether a $1.5 billion provision for bad debts stemming from Covid-19 shutdowns will be enough.
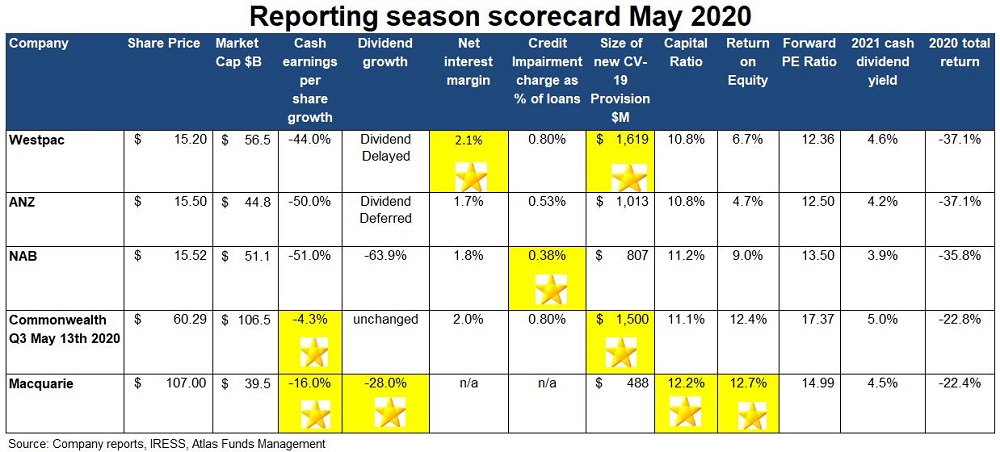
This article looks at the themes in the 800+ pages of financial results released over the past two weeks including Commonwealth Bank’s third quarter update, as we award gold stars based on performance over the past six months.
Uncertainty and loan provisions
Uncertainty was the key theme for the May 2020 results with the banking sector making guesses as to the impact that rising unemployment will have on both house prices and more importantly, bad debts. Significant rises in unemployment see increased business failures as well as the difficulty for stressed consumers to service mortgage and credit card debts.
In previous downturns such as 1982/83, 1991 and 2009, unemployment rose gradually, which allowed banks time to adjust their risk settings. The Covid-19 shutdowns will likely see unemployment move from 5.2% in March to a number close to 8% when the ABS releases April's unemployment rate, heading to over 10% by June. This dramatic step-change in economic activity would have been outside any of the bank's stress tests.
Due to a timing issue, the banks reported profit results to 31 March, so the data released would only capture a few weeks of business closures. Outlook statements contain a degree of guesswork on impairment charges, which will determine the size of the provision for bad debts. NAB has taken the lowest provision, which would typically get it the gold star, but there are no prizes for being too optimistic.
The market would prefer to see a provision written back than new provisions raised at the full-year results in October. Surprisingly, the two banks with the biggest exposure to mortgages (CBA and Westpac) have taken the largest provisions. Historically, ANZ and NAB have seen higher losses in downturns due to their greater exposure to business banking which is often unsecured.


Capital
All banks have core Tier 1 capital ratios above the Australian Prudential Regulation Authority (APRA) 'unquestionably strong' benchmark of 10.5%, despite the billions of dollars of provisions taken. This allowed Australia's banks to enter 2020 with a greater ability to withstand an external shock than was present in 2006 going into the GFC. For example, in 2006 Westpac had a Tier 1 capital ratio of 6.8% vs 10.8% today even after taking into account the $3 billion in provisions.
In the May results, there was a tone of self-congratulation from bank managements at their prudence for high levels of capital allowing management of Covid-19 from a position of strength. However, this is more due to a combination of luck and pressure from the regulator APRA (Australian Prudential Regulation Authority). APRA made moves in 2015 to increase the banks' capital to be "unquestionably strong and have capital ratios in the top quartile of internationally active banks". This saw Australia's banks raise $20 billion in capital, which at the time was unpopular with both investors and bank management teams and was viewed as excessively heavy-handed.
Additionally, both ANZ and Commonwealth Bank sold their wealth management and insurance businesses between 2017 and 2019 which generated excess billions of excess capital. This was expected to have been returned to shareholders in 2019, but this was derailed by the fallout from the Hayne Commission. NAB's slow moves to sell MLC saw the bank raising $3.5 billion in late April at a price that was dilutive for existing shareholders.
Macquarie comes out ahead of the trading banks, but this is due to the differences in the business model of the global investment bank that has seen lower loss provisions as well as an opportunistic capital raise conducted in mid-2019.
Dividends
Given the degree of uncertainty, the banks cut and suspended their dividends in May 2020, with encouragement from APRA which announced that expected "prudent reductions in dividends" during the crisis.
Westpac and ANZ could have paid a dividend underwritten by an investment bank, but this would not have been in the long-term interests of shareholders. An underwritten dividend would have seen the investment bank selling newly issued shares on market throughout May to pay for the dividend, diluting existing shareholders and putting further pressure on the share price. NAB paid a 30c dividend in May, which was an exercise in financial gymnastics as it was coupled with a capital raising, which saw investors give NAB capital which was immediately returned.
CBA's dividend in February was unchanged, but we expect a cut in August depending on the trajectory of bad debts. Macquarie cut their dividend but had a dividend payout ratio of 56%, which is well below their target range of between 60-80%.

Falling Net Interest Margins?
Falling Net Interest Margins (NIM) now seems like an issue of little significance given the other problems facing the banks. Bank NIMs [(Interest Received - Interest Paid) divided by Average Invested Assets] were expected to narrow in 2019/2020 given the collapse in Australian interest rates in 2019 and increased competition for lending.
The May 2020 reporting season saw NIMs remain stable at between 1.7% and 2.1%, with the banks more heavily exposed to mortgages (CBA and Westpac) traditionally having higher margins than the business banks (NAB and ANZ). The crisis has seen many borrowers in particular corporations increase their loans to ensure that they had liquidity on hand, particularly in March 2020. ANZ, for example, saw a $29 billion increase in its corporate loan book over the half, commenting that a significant proportion of these loans taken out were immediately put on deposit with the bank.
Additionally, these new loans are being priced at higher rates than the existing loan book, which has supported the banks' NIM. We expect loans to be repriced upwards when they come up for renewal, based on the banks pricing for higher levels of bad debts.

Our Take
The past few years have been tough for investors in Australia's banks which have faced hefty fines from regulators, a royal commission and now rising bad debts from a shutdown in the economy.
A big difference between the Covid-19 crisis and previous crises has been the speed and size of the fiscal responses. During the GFC, it took about 12 months for the politicians to respond, mainly due to the impression that those most affected were bankers and US sub-prime borrowers. In 2020, our political masters can see the impact of the virus on voters.
During the GFC peak, stimulus spending in Australia accounted for around 1.8% of GDP, while in 2020, the announced measures represent 9.5% of pre-crisis GDP. These policies will soften the impact of loan losses. Australia's banks have historically performed well coming out of crises that have reduced foreign competition and allowed them to absorb second-tier domestic banks. The threat posed by neobanks may well reduce as the Covid-19-inspired 'flight to quality' sees deposits switch to the major banks at a time when losses on the neobank loan books are increasing.
Hugh Dive is Chief Investment Officer of Atlas Funds Management. This article is for general information only and does not consider the circumstances of any investor.