After a savage sell off over 2022, the S&P 500, along with other major indices, officially entered bear territory in June, or a fall of 20% or more from recent highs. Investors are now worried that the sell-off could be worse if the US and major economies tip into recession.
Yet while bear markets and recessions are often linked, from an investment perspective, they are distinct. Why?
Bears and recessions don’t always hunt together
Firstly, bear markets and recessions do not always coincide.
Worsening economic conditions do have an impact on the psychology of the markets, which are inevitably driven by sentiment as well as fundamentals. Investors often respond to fears of recession, or growing pessimism about the overall economy, by becoming more risk averse and reducing their exposure to equities.
Yet four of the bear markets after World War II did not lead to a recession. For instance, the two bear markets in the 1960s that did not prefigure a recession were driven by interventions by the Federal Reserve to tame inflation, which allowed the authorities to orchestrate a ‘soft landing’.
Gummy or Grizzly?
The recent fall in the market has been more severe than the average bear market and is close to a level that has, in the past, preceded a recession. It remains to be seen if this bear market will be a ‘Gummy Bear’: a shallow fall, or a ‘Grizzly Bear’: a deep fall.
Bear markets that come before recessions tend to bottom out and begin to recover before the recession is over. Quick recoveries also tend to happen if no recession ensues (dark grey line):
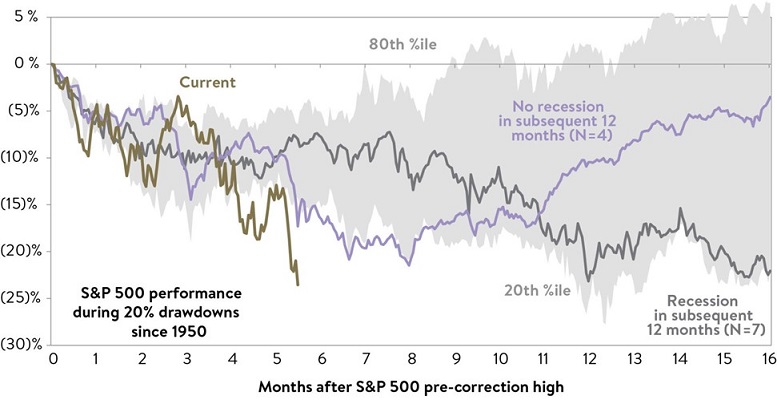
Taking a historical perspective, in the 12 U.S. recessions since World War II, the S&P 500 index has contracted from peak to trough by a median of 24%. If this were to be replicated, the S&P500 would fall to approximately 3,650. An average decline of 30% would reduce the S&P 500 to 3,360. (At time of publishing, the S&P500 closed on 27 July 2022 at about 4,000).
Falling valuations drive this bear market
So far, the US equity markets fall has mostly been about de-rating valuations (Price to Earnings ratios, or P/E) so they are appropriate for a more normalised 3-4% long-term interest rate environment.
Over the last 15 months, the historical earnings multiple of the S&P 500 has fallen from 32 times to 19 times, one of the swiftest and largest falls in valuation in history. The forward earnings multiple, which is based on expectations of future profitability, has fallen to around 16 times.
The current earnings multiples are still above the level hit by previous recession-linked bear markets, however. In the recession of 2020, the forward P/E ratio fell to 13 times and in the recession of 2008, it dropped to nine times.
The question now is, where to for earnings?
The market seems to be guessing whether harsher economic conditions will hit global corporate earnings, and, if so, how large the drop will be.
The picture will to some extent become clearer in the June quarter US reporting (during July/August) but will probably not be fully evident until after the September quarter reporting in October and November 2022.
Recession warning signs
The market is, however, flashing some warning lights about a recession.
One feature of this bear market, when compared with previous selloffs, is an unusually high level of volatility. About 20% of the trading days this year have seen the S&P 500 experience a price move greater than 2%. In the past 20 years, only 8% of annual trading days exhibited such volatility. It points to a high degree of uncertainty, although it should also be noted that about half of the turnover on the New York Stock Exchange is automated high-frequency trading, which could be contributing to the higher levels of activity.
Another indicator that may be of significance is that the dividend futures market is expecting that S&P 500 dividends will decline by nearly 5% in 2023. This points to a greater likelihood of a recession. For 60 years, S&P 500 dividends have not declined except during a recession.
Monetary policy will cause demand destruction and more rate rises are likely. The Federal Reserve is tightening monetary policy to rein in inflation, with 2022 seeing its most aggressive hikes since 1994 (another 0.75% increase in the Fed benchmark rate to 2.25%-2.50% was added on Wednesday 27 July).
But the rate is still low by historical standards and well below the June US annual inflation level of 9.1%. There are likely to be more rate rises given that real interest rates are in such strongly negative territory.
The era of cheap money, which has had a strongly positive effect on equity prices, seems to be over, at least while inflation is causing concerns.
Watching for the bottom
Past patterns are not always a guide and should be approached with caution. But they suggest that, although there is a risk that the market may have a way to go before reaching bottom, the severity and speed of the downturn suggest a substantial amount of the repricing has already occurred.
Historically, equities tend to stop declining when the market becomes confident that financial tightening has been sufficient, and the Fed has started easing rates. If a recession does occur, the case for increasing rates will become weaker, which may trigger such an easing.
Changes in the direction of inflation are another pointer to when the market has hit bottom. Equities on average decline when inflation is rising and approaching its peak, but they typically rebound quickly past that peak if a recession is avoided. If a recession materialises, history suggests that equities are likely to remain under pressure for six months after the inflation peak.
Using economy-wide data to identify when the market will hit its lowest point is especially flawed because of the difference between lagging indicators and future expectations.
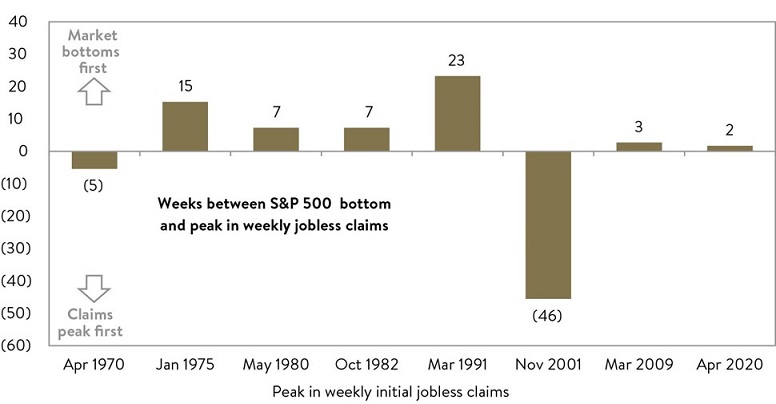
One of the better indicators, though, may be high frequency employment data, which are a more specific economic measure. The bottom of the equity market has generally exhibited a relationship with the peak in weekly jobless claims. Since 1970, the S&P 500 has reached its local trough within weeks of the peak in weekly jobless claims.
The problem still though is a lack of consistency between jobless claim tops and equity market bottoms, and that often months can still separate them.
Markets tend to bounce strongly after bear markets
The good news is that this environment is throwing up opportunities and setting up stronger returns for investors.
It is an investment truism that generally the best time to buy, and the worst time to sell, is when the market has entered bear territory.
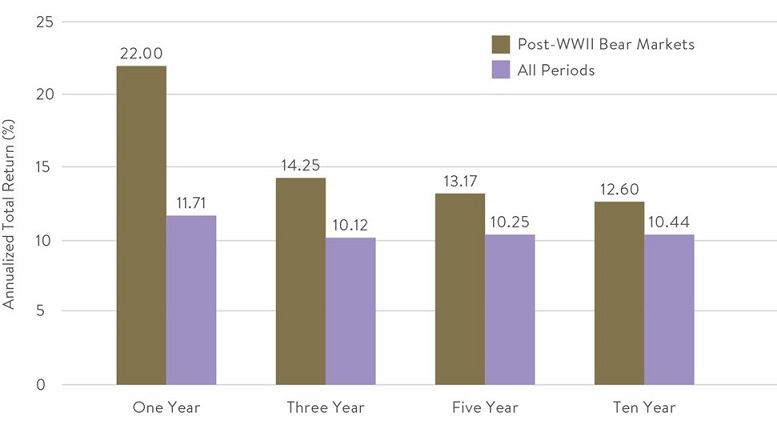
Looking at the S&P 500 bear markets that have occurred after World War II, the average one-year return after the bear market was 22%, which is almost double the average return over all periods.
The best short-term returns usually occur when the market bounces back.
The three-year return after a bear market was 14.25%; the five-year return was 13.17% and the 10-year return was 12.60%. In all these time periods the post-bear market returns were substantially above the average return for all periods:
Opportunities in small caps
The most common strategic response to tightening financial conditions, slowing economic growth, and elevated market volatility is to shift to big cap, stable companies with robust and predictable earnings streams.
But the flip side of this is that at the smaller end of the market this often creates greater mispricings that provide significant buying opportunities.
This time there has been some overly aggressive price falls of small caps. The selloff in the small and medium-cap sector has been greater than usual and they are, in relative terms, unusually cheap, trading at a historically big discount to large-cap companies.
We are now finding some wonderful businesses that were too expensive for us to own in the past but are now close to levels that we think provide great investment opportunities. We have seen these times before when indiscriminate and liquidity driven sell offs push down the valuations of some businesses to unsustainable levels given the strength of their underlying operations. We think this bodes well for investment returns for those that fit this mould during the inevitable market recovery.
But attempting to pick the bottom of a bear market can be counterproductive. Being a few days or weeks too late or too early can mean failing to outperform a buy and hold strategy.
Andrew Mitchell is Director and Senior Portfolio Manager at Ophir Asset Management, a sponsor of Firstlinks. This article is general information and does not consider the circumstances of any investor.
Read more articles and papers from Ophir here.