One of the benefits for investors in Exchange Traded Funds (ETFs) is their tradability. Unlike traditional funds, ETFs can be bought and sold at any time through the Australian Securities Exchange (ASX) just like an ordinary share.
But since ETFs trade like shares, investors may mistakenly attempt to evaluate their liquidity in the same way they might for shares. This gives rise to one of the most common misunderstandings about ETFs, namely, that an ETF’s ‘on-screen’ volume equates to ETF liquidity.
This misperception reflects the fact that, by comparing them to shares, many investors assume that ETF liquidity is driven by the same factors, namely:
- the ETF’s size (funds under management)
- average daily volume traded
- the volume of units quoted ‘on screen’ at any given time.
For ETFs, however, these measures often vastly understate their effective liquidity. The best measure of an ETF’s liquidity is the liquidity of the underlying portfolio of securities (such as company shares) it holds.
ETF open-ended structure facilitates liquidity
The open-ended structure of ETFs effectively means their supply on offer can adjust to demand through the trading day.
In the case of shares, for example, the number of outstanding shares available for trading on any given day is fixed by the level of supply, irrespective of the level of investor demand. As a result, the ability of the market to accommodate swings in demand without affecting prices too much is quite rightly related to the average daily trading volume of these shares.
ETFs, on the other hand, are open-ended funds, meaning supply can adjust to swings in demand throughout the trading day. How so? Each ETF trading on the ASX has one or more dedicated market makers. Uniquely to ETFs, these market makers have an ability to add to or withdraw from the supply of ETF units by trading directly with the ETF issuer (such as with BetaShares).
Indeed, unlike the typical company that lists its shares on the market (including listed investment companies, or LICs), ETF issuers stand ready to buy back or sell ETF units to ETF market makers at the net asset value or NAV of the underlying portfolio of securities the ETF holds. Should investor ETF demand exceed what is currently available ‘on screen’, the market makers can simply create more units (issued by the ETF issuer) to meet the demand. Similarly they can also redeem their units should supply exceed demand. The ETF units issued or redeemed are exchanged for the underlying holdings that comprise the ETF and therefore the liquidity of these underlying holdings is the key determinant of the real liquidity. The volume displayed for sale or purchase at any given moment is only a glimpse of what is available.
Why prices stay close to the NAV
What’s more, due to competition between ETF market makers – and their potential to make ‘arbitrage profits’ in trading ETFs - the best bid and offer prices quoted for an ETF will typically be close to its NAV.
To see why, consider what would happen if an ETF’s current offer price (i.e. the price at which you could buy it on the exchange) was well above the NAV of its underlying portfolio of securities. In this case, an ETF market maker could buy up parcels of the underlying securities and exchange them for ETF units with the ETF provider, and the ETF units could then be sold on market at a profit. This process would continue until the ETF’s prices were bid down (and the price of the underlying securities bid up) until this arbitrage profit opportunity was eliminated.
Similarly, if the ETF’s offer price was well below the NAV of its underlying securities, the ETF market maker could then buy ETF units on the market and exchange them with the ETF provider for parcels of the underlying securities, which could then be sold on market at a profit. Again this process would continue until the price of the ETF was better aligned with the NAV of the underlying securities.
ETFs are as liquid as their underlying holdings
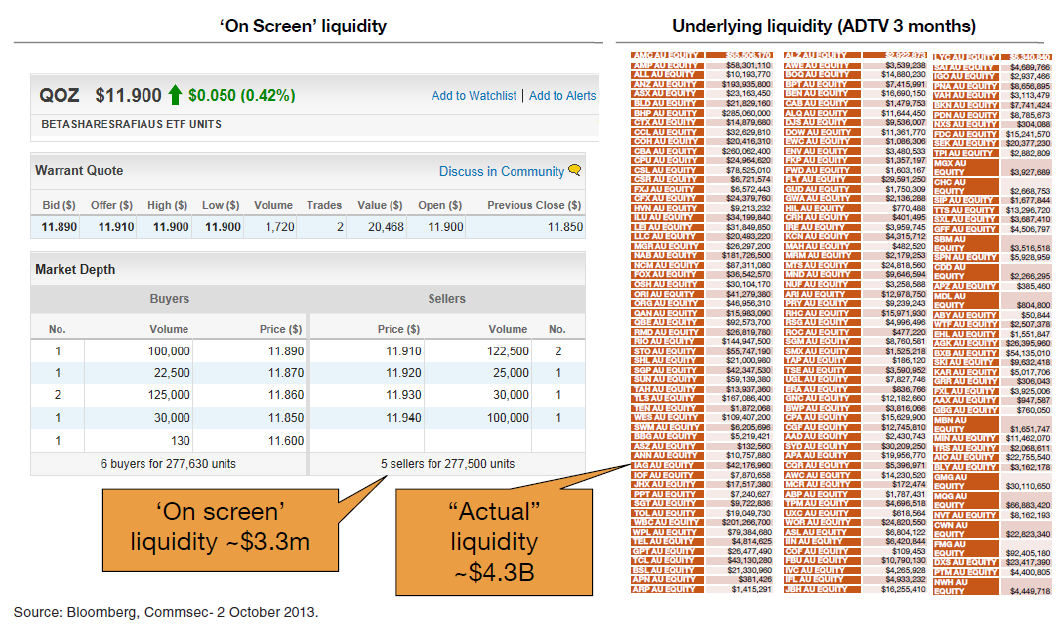
Given the way ETFs work, their ‘true’ daily liquidity is best reflected by the average daily volume of their underlying holdings. As seen in the example below - using the BetaShares FTSE RAFI Australia 200 ETF – while there was only around $3.3 million worth of the ETFs available for sale or purchase at the time of this snapshot, the ‘true’ daily liquidity of its underlying constituents was actually around $4.3 billion.
At present, most ETFs available in Australia have underlying portfolios that are highly liquid, which contributes to robust liquidity levels and generally ensures that the price of the ETF closely reflects the value of the underlying portfolio.
With this depth of underlying liquidity, it’s also possible for trading in an ETF to spike on a particular day with virtually no impact on spreads.
As seen in the example below, trading in the BetaShares U.S. Dollar ETF on a particular day in December 2014 spiked to 2.5 million units ($31 million) which was 12.5 times the average daily volume traded over the prior 90 days. The bulk of this trading ($26 million) occurred in just nine minutes between 11.35am and 11.44am without impacting the overall spread of the ETF. Here is an actual example of how the market maker was able to tap the liquid foreign currency market to source US dollars and then provide them to the ETF provider in exchange for newly created ETF units.
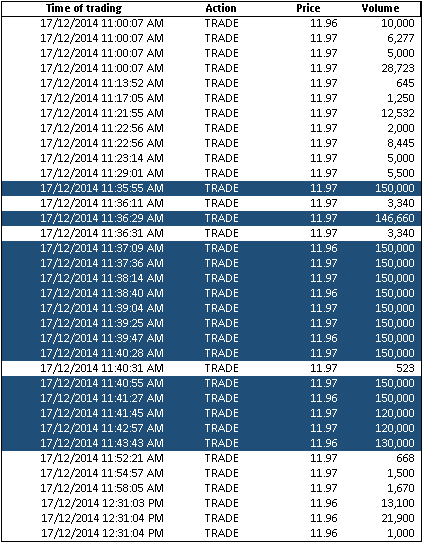
Source: Bloomberg
Tips on trading ETFs
Despite their unique advantages, some care is still required in trading ETFs, especially if the intended volumes are relatively large. As seen in the example above, limited quantities of an ETF might be shown for sale or purchase at the best bid and offer prices at any particular moment. As with any normal quote screen, other traders or investors may also have stock available for sale or purchase at less favourable prices.
As a result, as with trading company shares, investors should refrain from simply placing large ‘at market’ orders, as there is the risk of having one’s order cascade down and being filled at less than the best prices possible. In these cases, it’s better to stagger trades by placing smaller market or limit orders that do not exceed the volumes currently available at the best prices on offer.
Unlike trading in company shares, however, once an ETF trade is completed, the market makers will typically quickly replenish the volumes available at these same best prices, unless the ETF’s NAV has suddenly changed.
If in doubt about an ETF’s underlying NAV, most ETF providers have real-time estimations (indicative net asset values or ‘iNAVs’) available through the trading day. The iNAV for a given ETF can be usually be found on the issuer’s website, where it will change in real-time, or alternatively, the issuer website will point to an ‘iNAV ticker’, where the iNAV can be found like any share price on the ASX (for example, the iNAV for BetaShares FTSE RAFI Australia 200 ETF can tracked at any time during the trading day using the ASX ticker ‘YQOZ’).
Louis Crous is Senior Portfolio Manager, BetaShares, a leading manager of exchange traded funds. This article is for general information purposes and does not constitute personal financial advice.