Register For Our Mailing List

Register to receive our free weekly newsletter including editorials.

Home / 276

Financial assets performance over time

Advertisements for superannuation funds usually come with an obligation to add “past performance is not a reliable guide to future returns”. This is certainly true on a year by year basis, where the pecking order of classes of assets and fund managers have some volatility. Indeed, when it comes to asset classes, it is rare for the same class to top the ladder year after year.

The volatility of Australian shares over the past 150 years is evident in the chart below.

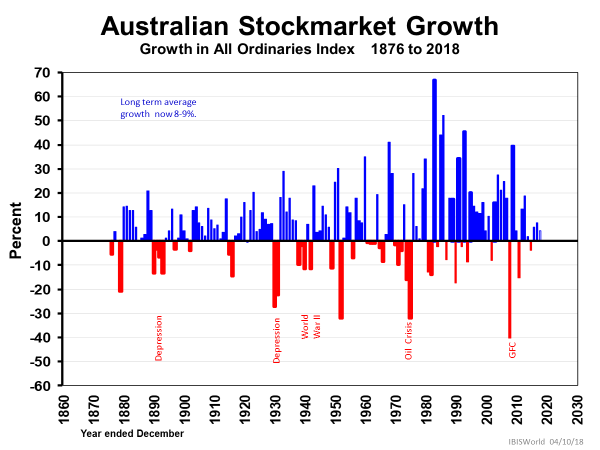
Indeed, the amplitudes of rises and falls is alarming. Of compensating solace is the fact that the All Ordinaries Accumulation Index continues to climb, and the combination of dividends and capital gain has been rewarding to long-term investors for a long time.

So, what are our investment choices?

The main asset classes are:

  • Shares (local & international)
  • Property (real and trusts)
  • Bonds
  • Cash
  • Precious metals (gold, silver, gemstones etc.)
  • Collectables (art, stamps, vintage cars etc.)

How have these performed over time? The following charts show the returns over 20 and 10 years.

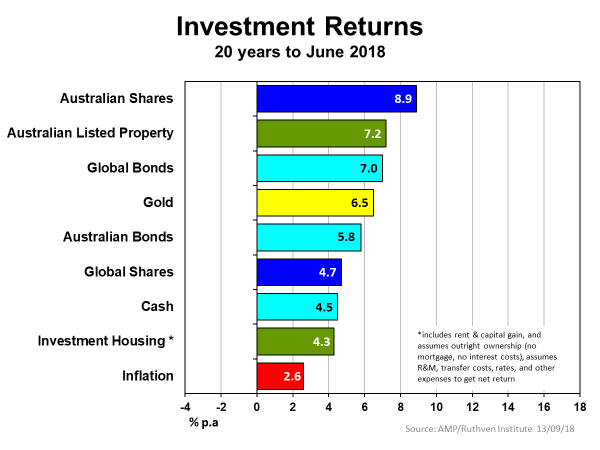
While riskier assets (shares) should always yield better returns than more passive (or defensive) assets (bonds, property, collectibles and precious metals), they don’t necessarily do so. Global shares in the 20 years since 1998 were impacted by the dot-com bubble and meltdown in 2000, and the GFC in 2008. Less so Australian shares, which missed out on both crashes. Gold did much better than usual, being a panic metal these days but a perceived safe-house over this period.

There was a different story over the past 10 years as we see below.

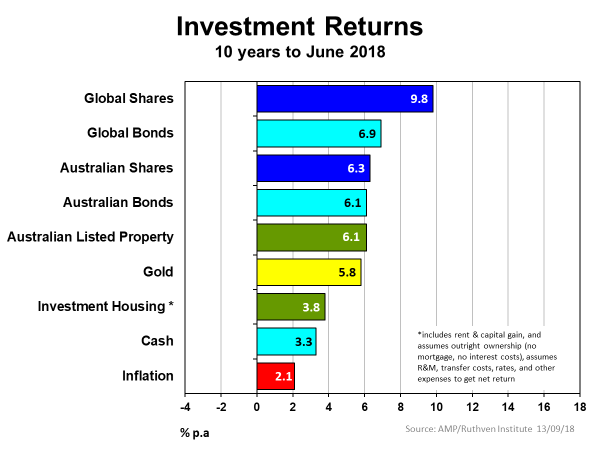
Global shares did best, with Australian shares in third place, sandwiching listed property which has done well over both time periods. Gold resumed its normally low position, along with investment housing which consistently performs badly over long periods.

However, when we take a short period – say 5 years, as shown in the last exhibit – and combine that with some extraordinary developments, some surprises emerge.

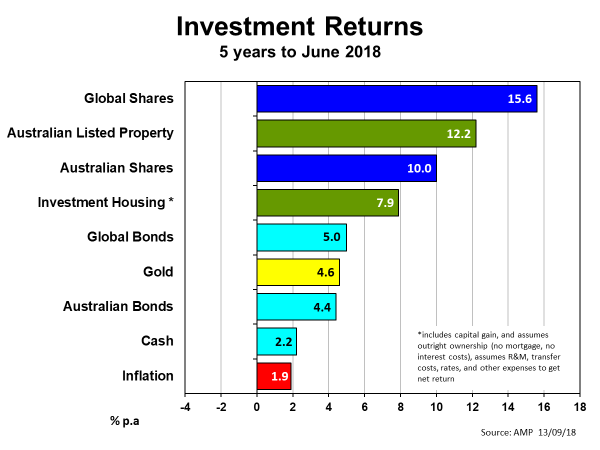
Alarm bells are ringing

Firstly, global shares have done extraordinarily well in an environment of record-low interest rates. But with P/E ratios nudging 20:1 (with a small reversal last week, but longer term, compare to a safer 14:1) across the world, alarm bells are ringing for returns over the next five years. Ditto investment dwelling prices and returns in Australia, where bubble prices in Sydney have been experienced, accompanied by one of the highest mortgage debt to GDP ratios in the world.

All that said, it seems shares and listed property classes are the consistent best performers over long periods. Perhaps online shopping could dent listed property returns in the future.

However, if shares, as the riskiest active-class investment of the lot, don’t stay at or close to the top, it's because the economy is in bad shape via:

  • a depression
  • an asset crash from excessive exuberance, or
  • underperforming businesses.

Fund managers and SMSFs usually choose to be conservative by having around half their funds in active (riskier) assets while taking out insurance via other assets and cash. Just in case.


Phil Ruthven AM is Founder of IBISWorld and is recognised as one of Australia’s foremost business strategists and futurists. This article is general information and does not consider the circumstances of any investor.

RELATED ARTICLES

Diversification is not a free lunch

How to invest in funds for free (almost)

Best and worst performing equity funds of 2020

banner

Most viewed in recent weeks

Australian house prices close in on world record

Sydney is set to become the world’s most expensive city for housing over the next 12 months, a new report shows. Our other major cities aren’t far behind unless there are major changes to improve housing affordability.

The case for the $3 million super tax

The Government's proposed tax has copped a lot of flack though I think it's a reasonable approach to improve the long-term sustainability of superannuation and the retirement income system. Here’s why.

7 examples of how the new super tax will be calculated

You've no doubt heard about Division 296. These case studies show what people at various levels above the $3 million threshold might need to pay the ATO, with examples ranging from under $500 to more than $35,000.

The revolt against Baby Boomer wealth

The $3m super tax could be put down to the Government needing money and the wealthy being easy targets. It’s deeper than that though and this looks at the factors behind the policy and why more taxes on the wealthy are coming.

Meg on SMSFs: Withdrawing assets ahead of the $3m super tax

The super tax has caused an almighty scuffle, but for SMSFs impacted by the proposed tax, a big question remains: what should they do now? Here are ideas for those wanting to withdraw money from their SMSF.

The super tax and the defined benefits scandal

Australia's superannuation inequities date back to poor decisions made by Parliament two decades ago. If super for the wealthy needs resetting, so too does the defined benefits schemes for our public servants.

Latest Updates

Planning

Will young Australians be better off than their parents?

For much of Australia’s history, each new generation has been better off than the last: better jobs and incomes as well as improved living standards. A new report assesses whether this time may be different.

Superannuation

The rubbery numbers behind super tax concessions

In selling the super tax, Labor has repeated Treasury claims of there being $50 billion in super tax concessions annually, mostly flowing to high-income earners. This figure is vastly overstated.

Investment strategies

A steady road to getting rich

The latest lists of Australia’s wealthiest individuals show that while overall wealth has continued to rise, gains by individuals haven't been uniform. Many might have been better off adopting a simpler investment strategy.

Economy

Would a corporate tax cut boost productivity in Australia?

As inflation eases, the Albanese government is switching its focus to lifting Australia’s sluggish productivity. Can corporate tax cuts reboot growth - or are we chasing a theory that doesn’t quite work here?

Are V-shaped market recoveries becoming more frequent?

April’s sharp rebound may feel familiar, but are V-shaped recoveries really more common in the post-COVID world? A look at market history suggests otherwise and hints that a common bias might be skewing perceptions.

Investment strategies

Asset allocation in a world of riskier developed markets

Old distinctions between developed and emerging market bonds no longer hold true. At a time where true diversification matters more than ever, this has big ramifications for the way that portfolios should be constructed.

Investment strategies

Top 5 investment reads

As the July school holiday break nears, here are some investment classics to put onto your reading list. The books offer lessons in investment strategy, financial disasters, and mergers and acquisitions.

Sponsors

Alliances

© 2025 Morningstar, Inc. All rights reserved.

Disclaimer
The data, research and opinions provided here are for information purposes; are not an offer to buy or sell a security; and are not warranted to be correct, complete or accurate. Morningstar, its affiliates, and third-party content providers are not responsible for any investment decisions, damages or losses resulting from, or related to, the data and analyses or their use. To the extent any content is general advice, it has been prepared for clients of Morningstar Australasia Pty Ltd (ABN: 95 090 665 544, AFSL: 240892), without reference to your financial objectives, situation or needs. For more information refer to our Financial Services Guide. You should consider the advice in light of these matters and if applicable, the relevant Product Disclosure Statement before making any decision to invest. Past performance does not necessarily indicate a financial product’s future performance. To obtain advice tailored to your situation, contact a professional financial adviser. Articles are current as at date of publication.
This website contains information and opinions provided by third parties. Inclusion of this information does not necessarily represent Morningstar’s positions, strategies or opinions and should not be considered an endorsement by Morningstar.