Register For Our Mailing List

Register to receive our free weekly newsletter including editorials.

Home / 195

Future oil prices: it takes two to contango

The recovery in oil prices during the past year, as measured by the price of Brent Crude Oil, has provided a welcome respite for investors exposed to direct commodities, energy-related stocks and high-yield debt, particularly for North American shale oil producers.

While short-term predictions are fraught with danger, futures markets provide context as to where market participants believe oil prices should be over the medium term. This article provides a deeper understanding of oil pricing dynamics and the prospects for crude oil prices [Editor's Note: a 'contango' is where the futures or forward price of a commodity is above the spot price].

Forward curve dynamics

Futures markets provide an insight into the incentive pricing for producers, hedgers, and speculators to act. The spot price is typically quoted on news and business channels, but futures markets provide price points for multiple tenors in the future which can be used by market participants to either hedge production, hedge-pricing risk for buyers, or take a position, as is the case for speculators.

Further ‘along the curve’ (looking at prices that are at least six to 12 months in the future), there tends to be less noise and more signals which are reflective of market fundamentals. If this were not the case, there would be an opportunity to arbitrage for those investors able to participate in both the physical (spot) market and hedge using futures.

Brent Crude Oil forward curve fair value per barrel in US Dollars

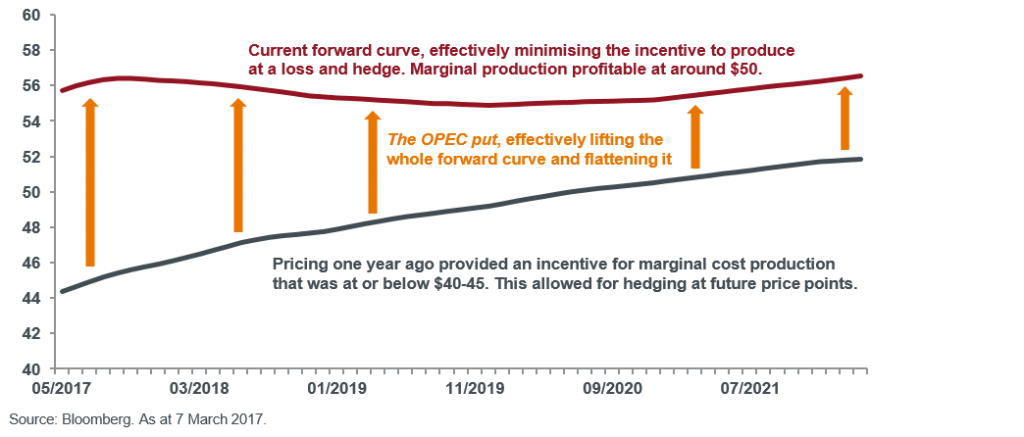
The chart shows forward pricing for Brent Crude Oil as of 7 March 2017 (the ‘forward curve’, shown in red) and compares this to the forward curve one year ago (shown in grey).

The chart provides a number of insights:

1. Oil markets are back in balance

Since the announcement by OPEC in late 2016 of production limits, oil markets have been rebalancing. While this doesn’t negate the effect of currently high levels of global inventories, the forward curves illustrate how the forward curve has effectively shifted up and flattened. This is historically associated with positive performance for the immediate future as there is less incentive to produce today and forward hedge (prices are flat for the immediate future).

2. Shale picks up market share, ‘ROPEC’ picks up revenue

The wild card in the oil market deck is now North American shale oil production. A combination of recent increases in rig counts and falling marginal costs for certain oil basins mean that OPEC shares swing production with US shale producers.

Current pricing provides an incentive for more marginal production to come on line in the US, so this will likely translate into higher market share for shale as a percentage of global oil production, while OPEC and Russia (AKA ‘ROPEC’) benefit via increased revenues, albeit at lower production levels.

3. Aramco IPO in the balance

It is in the interests of the Saudi Arabians to maintain prices around these levels. With the proposed IPO of Aramco in the next two years, its oil assets would be priced at the average price of the past 12 months. A major objective of Saudi oil production would be to maintain pricing at these levels to keep them low enough not to encourage a major increase in shale production, but high enough to provide a reasonable valuation on oil reserves. The Aramco IPO could potentially make it the largest listed oil company in the world, above Exxon Mobil Corporation.

Conclusion on the oil market

Current oil market pricing in the mid-US$50 range is a ‘sweet spot’ for all major oil market participants, including OPEC, Russia and the more productive and cost efficient North American shale producers. Barring unexpected events, oil prices will likely remain range-bound for the medium term, with an effective floor of around US$50 as the base case. The abyss oil markets experienced in early 2016 provided an insight into the instability created by an oversupply in energy markets, and this will be front and centre to ‘ROPEC’ in encouraging strict compliance with production quotas.


Andrew Kaleel and Matthew Kaleel are Co-heads of Global Commodities & Managed Futures at Henderson Global Investors. This information is general only and does not take into account the personal circumstances or financial objectives of any reader.


Leave a Comment:

RELATED ARTICLES

Oil does not have a supply side problem

The end of Russian oil

The tipping point for investing in decarbonisation

banner

Most viewed in recent weeks

The case for the $3 million super tax

The Government's proposed tax has copped a lot of flack though I think it's a reasonable approach to improve the long-term sustainability of superannuation and the retirement income system. Here’s why.

7 examples of how the new super tax will be calculated

You've no doubt heard about Division 296. These case studies show what people at various levels above the $3 million threshold might need to pay the ATO, with examples ranging from under $500 to more than $35,000.

The revolt against Baby Boomer wealth

The $3m super tax could be put down to the Government needing money and the wealthy being easy targets. It’s deeper than that though and this looks at the factors behind the policy and why more taxes on the wealthy are coming.

Meg on SMSFs: Withdrawing assets ahead of the $3m super tax

The super tax has caused an almighty scuffle, but for SMSFs impacted by the proposed tax, a big question remains: what should they do now? Here are ideas for those wanting to withdraw money from their SMSF.

The super tax and the defined benefits scandal

Australia's superannuation inequities date back to poor decisions made by Parliament two decades ago. If super for the wealthy needs resetting, so too does the defined benefits schemes for our public servants.

Are franking credits hurting Australia’s economy?

Business investment and per capita GDP have languished over the past decade and the Labor Government is conducting inquiries to find out why. Franking credits should be part of the debate about our stalling economy.

Latest Updates

Superannuation

Here's what should replace the $3 million super tax

With Div. 296 looming, is there a smarter way to tax superannuation? This proposes a fairer, income-linked alternative that respects compounding, ensures predictability, and avoids taxing unrealised capital gains. 

Superannuation

Less than 1% of wealthy families will struggle to pay super tax: study

An ANU study has found that families with at least one super balance over $3 million have average wealth exceeding $19 million - suggesting most are well placed to absorb taxes on unrealised capital gains.   

Superannuation

Are SMSFs getting too much of a free ride?

SMSFs have managed to match, or even outperform, larger super funds despite adopting more conservative investment strategies. This looks at how they've done it - and the potential policy implications.  

Property

A developer's take on Australia's housing issues

Stockland’s development chief discusses supply constraints, government initiatives and the impact of Japanese-owned homebuilders on the industry. He also talks of green shoots in a troubled property market.

Economy

Lessons from 100 years of growing US debt

As the US debt ceiling looms, the usual warnings about a potential crash in bond and equity markets have started to appear. Investors can take confidence from history but should keep an eye on two main indicators.

Investment strategies

Investors might be paying too much for familiarity

US mega-cap tech stocks have dominated recent returns - but is familiarity distorting judgement? Like the Monty Hall problem, investing success often comes from switching when it feels hardest to do so.

Latest from Morningstar

A winning investment strategy sitting right under your nose

How does a strategy built around systematically buying-and-holding a basket of the market's biggest losers perform? It turns out pretty well, so why don't more investors do it?

Sponsors

Alliances

© 2025 Morningstar, Inc. All rights reserved.

Disclaimer
The data, research and opinions provided here are for information purposes; are not an offer to buy or sell a security; and are not warranted to be correct, complete or accurate. Morningstar, its affiliates, and third-party content providers are not responsible for any investment decisions, damages or losses resulting from, or related to, the data and analyses or their use. To the extent any content is general advice, it has been prepared for clients of Morningstar Australasia Pty Ltd (ABN: 95 090 665 544, AFSL: 240892), without reference to your financial objectives, situation or needs. For more information refer to our Financial Services Guide. You should consider the advice in light of these matters and if applicable, the relevant Product Disclosure Statement before making any decision to invest. Past performance does not necessarily indicate a financial product’s future performance. To obtain advice tailored to your situation, contact a professional financial adviser. Articles are current as at date of publication.
This website contains information and opinions provided by third parties. Inclusion of this information does not necessarily represent Morningstar’s positions, strategies or opinions and should not be considered an endorsement by Morningstar.