Over the last 15 years, the US stockmarket has come to dominate global passive portfolios, with its weight in the MSCI World Index rising from below 50% to nearly 75%. That ascent was driven by exceptional returns. Since 2010, the S&P 500 has returned 13.8% per annum—much higher than markets elsewhere, exceptionally high versus its own history and inflation, and a near-record result against bonds and cash.
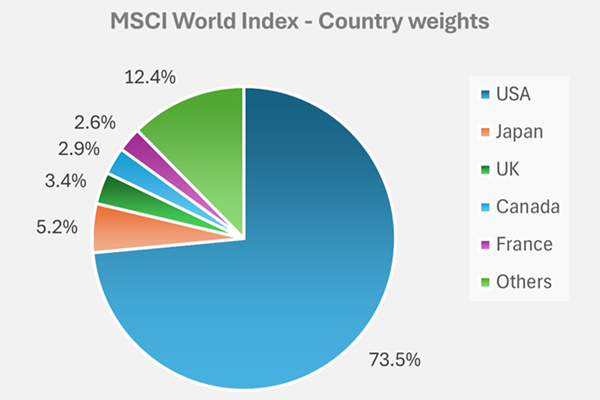
Source: MSCI.com, as of 31 December 2024.
Charts showing the S&P’s staggering performance are easy to find, often with the implicit message that what goes up must come down. That’s both unsatisfying and not how markets work.
The key drivers for US outperformance
It’s more useful to understand what drove those returns, and what investors need to believe to expect similar returns again. As we’ve written before, equity returns come from just three sources: fundamental growth, change in valuation, and dividends. We can get a slightly clearer picture here by splitting fundamental growth into sales growth and change in margins. So where did the S&P’s 13.8% p.a. come from?
The first driver was sales growth. American companies grew their sales by 5.2% p.a.—a little low versus history, but then so was inflation. To see what happened to earnings, we need to look at margins. In 2010 net profit margins were 9%. Over the following years, margins expanded dramatically, to about 13%. Margins going up boosted returns to the tune of 2.5% p.a.
Putting sales and margins together gives us earnings. To get price, the next piece is the price-earnings ratio. In 2010 the S&P traded at 15 times trailing earnings. Valuations have since got much more expensive, and the US market now trades at 25 times earnings. Rising valuations kicked in 3.6% p.a. to the S&P’s stellar return. The last piece is dividends, which contributed 1.9% p.a.
Scenarios for future returns
Now, let’s say we want to re-run history. What do we have to believe to expect 13.8% p.a. again?
Sales growth and dividends are reasonably stable, so let’s say they contribute at the same rate as the past cycle. That leaves changes in margins and changes in valuations.
For margin expansion to boost returns by 2.5% p.a. again, margins need to go up again, from today’s much higher starting point. Margins are cyclical, and they are currently near record highs. Doing the numbers, a boost of 2.5% p.a. would require net profit margins at 18% by 2040—higher than the US has ever seen.
Similarly, for rising valuations to boost returns by 3.6% p.a. again, valuations need to go up again, from today’s much more expensive levels. At 25 times trailing earnings, the S&P’s current valuation has only been eclipsed at the top of the tech and Covid bubbles. To expect another 3.6% p.a. boost to returns, valuations need to end up at 40 times earnings. Again, this would be a record by some distance.
Putting it together, roughly half of the S&P’s tremendous recent returns came from rising margins and valuations. If we want a re-run, we have to expect net margins to reach 18% and valuations to hit 40 times earnings. Crazier things have happened, but it’s tough to make the numbers work.
What if margins and valuations don’t help, but don’t hurt either? If both stay at their current near-record levels, that would leave sales growth and dividends to drive returns. Sales and dividends chugging along would suggest returns of 7.2% p.a. That’s normal over the very long term, but it’s roughly half what we saw over the latest period. And that’s if valuations and margins stay very, very high.
What if they fall to 20-year-average levels? That captures the period since Google’s listing where highly profitable, highly valued tech businesses have been ascendant. If margins and valuations fall, the numbers suggest a 3.4% p.a. long-term return for the S&P—less than the yield on US Treasury bonds. Said another way, the broad US stockmarket is dependent on great expectations. Great expectations are already in the price, so to expect a great return, investors need to believe that reality will prove even more amazing than markets already expect.
A few things could help there. Sales growth has often been higher historically. Companies are the ones raising prices, so they can usually more or less capture inflation through sales growth. Higher sales growth from inflation would boost the S&P’s absolute return, but not its real return.
Margins could continue to climb. A corporate tax cut helped before and could again. But strategies to reduce corporate taxes also reduce the benefit of any corporate tax cuts. Huge and hugely profitable companies could continue to thrive, pulling up the average margin for the market. But society does not suffer ever-rising profit margins forever. Monopoly-like margins attract competition and regulation, politicians dislike rival power centres, and workers dislike prices and profits growing faster than wages.
Expectations in the US are high, and when expectations are high, so is risk. Fortunately, low expectations are easier to find pretty much everywhere else. Stocks outside the US are cheaper, whether you weight them equally, by size, or look just at the ‘value’ or mid-sized companies. The US is not fruitless—some of our highest-conviction holdings are American companies. But generally we’ve found other markets to be more fruitful hunting grounds for undervalued ideas. We are far happier seeking low expectations.
Eric Marais is an Investment Specialist at Orbis Investments, a sponsor of Firstlinks. This article contains general information at a point in time and not personal financial or investment advice. It should not be used as a guide to invest or trade and does not take into account the specific investment objectives or financial situation of any particular person. The Orbis Funds may take a different view depending on facts and circumstances.
For more articles and papers from Orbis, please click here.