Why should long-term investors care about market forecasts? Vanguard, after all, has long counselled investors to set a strategy based on their investment goals and to stick to it, tuning out the noise along the way.
The answer is that market conditions change, sometimes in ways with long-term implications. Tuning out the noise - the day-to-day market chatter that can lead to impulsive, suboptimal decisions - remains important. But so does occasionally reassessing investment strategies to ensure that they rest upon reasonable expectations.
It wouldn’t be reasonable, for example, for an investor to expect a 5% annual return from a bond portfolio, around the historical average, in our current low-rate environment. As the late Vanguard Founder John 'Jack' Bogle wrote:
“Treat history with the respect it deserves. Neither too much nor too little.”1
In fact, the Vanguard Capital Markets Model® (VCMM) suggests that investors should prepare for a decade of returns below historical averages for both stocks and bonds.
The value of market forecasts rests on reasonable expectations
The role of a forecast is to set reasonable expectations for uncertain outcomes upon which current decisions depend. Our forecasts inform our active managers’ allocations and the longer-term allocation decisions in our multi-asset and advice offers.
Being right more frequently than others is certainly a goal. But short of such a silver bullet, we believe that a good forecast objectively considers the broadest range of possible outcomes, clearly accounts for uncertainty, and complements a rigorous framework that allows for our views to be updated as facts bear out.
So how have our market forecasts fared, and what lessons do they offer?
Some errors in our forecasts and the lessons they offer
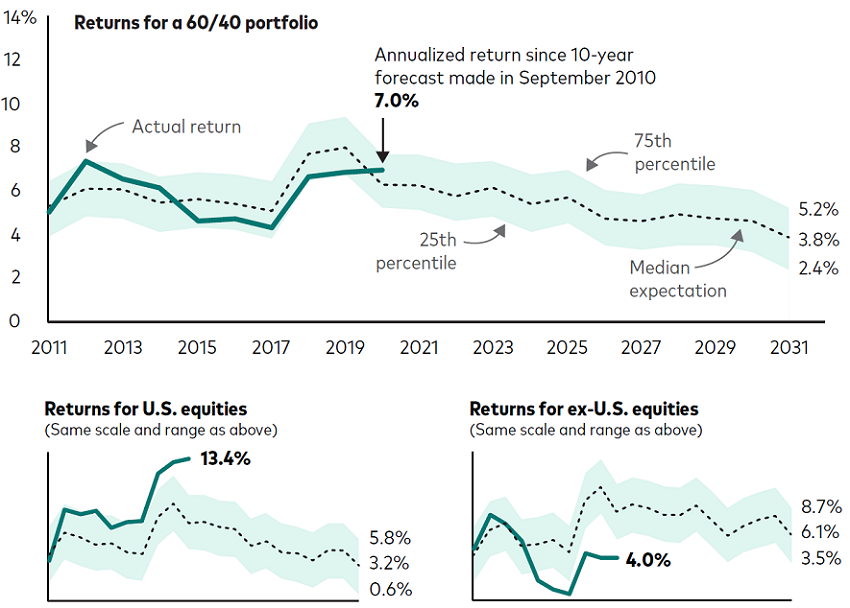
Source: Vanguard calculations, using data from MSCI and Bloomberg. See notes at end for more details on the benchmarks used.
The illustration shows that 10-year annualised returns for a 60% stock/40% bond portfolio over the last decade largely fell within our set of expectations. Returns for U.S. equities surpassed our expectations, while returns for ex-U.S. equities were lower than we had expected.
The data reinforce our belief in balance and diversification, as discussed in Vanguard’s Principles for Investing Success. We believe that investors should hold a mix of stocks and bonds appropriate for their goals and should diversify these assets broadly, including globally.
You may notice that our long-run forecasts for a diversified 60/40 portfolio haven’t been constant over the last decade, nor have the 60/40 market returns. Both rose toward the end of the decade, or 10 years after markets reached their depths as the GFC was unfolding. Our framework recognised that although economic and financial conditions were poor during the crisis, future returns could be stronger than average. In that sense, our forecasts were appropriate in putting aside the trying emotional strains of the period and focusing on what was reasonable to expect. Our outlook then was one of cautious optimism, a forecast that proved fairly accurate.
Today, financial conditions are quite loose - some might even say exuberant. Our framework forecasts softer returns based on today’s ultralow interest rates and elevated U.S. stock market valuations. That can have important implications for how much we save and what we expect to earn on our investments.
Why today’s valuation expansion limits future U.S. equity returns
Valuation expansion has accounted for much of U.S. equities’ greater-than-expected returns over a decade characterised by low growth and low interest rates. That is, investors have been willing, especially in the last few years, to buy a future dollar of U.S. company earnings at higher prices than they’d pay for those of ex-U.S. companies.
Today’s high valuations suggest a far more difficult climb in the decade ahead. The big gains of recent years make similar gains tomorrow that much harder to come by unless fundamentals also change. U.S. companies will need to realise rich earnings in the years ahead for recent investor optimism to be similarly rewarded.
More likely, according to our VCMM forecast, stocks in companies outside the United States will strongly outpace U.S. equities - in the neighborhood of 3% a year - over the next decade.
We encourage investors to look beyond the median, to a broader set between the 25th and 75th percentiles of potential outcomes produced by our model. At the lower end of that scale, annualised U.S. equity returns would be minuscule compared with the lofty double-digit annual returns of recent years.
What to expect in the decade ahead
This brings me back to the value of forecasting.
Our forecasts today tell us that investors shouldn’t expect the next decade to look like the last, and they’ll need to plan strategically to overcome a low-return environment.
Knowing this, they may plan to:
- save more
- reduce expenses
- delay goals (perhaps including retirement), and
- take on some active risk where appropriate.
And they may be wise to recall something else Jack Bogle said:
“Through all history, investments have been subject to a sort of Law of Gravity: What goes up must go down, and, oddly enough, what goes down must go up.”2
1 Bogle, John C., 2015. Bogle on Mutual Funds: New Perspectives for the Intelligent Investor. 2 Jenks, Philip, and Stephen Eckett, 2002. The Global-Investor Book of Investing Rules: Invaluable Advice from 150 Master Investors.
Notes to chart: The figures show the forecast and realised 10-year annualised returns for a 60% stock/40% bond portfolio, for U.S. equities, and for ex-U.S. equities (all U.S. dollar-denominated). On each figure, the last point on the darker line is the actual annualized return from the 10 years beginning October 1, 2010, and ended September 30, 2020, and covers the same period as the Vanguard Capital Markets Model (VCMM) forecast as of September 30, 2010. The last points on the dashed line and the surrounding shaded area are our forecasts for annualized returns at the 25th, 50th (median), and 75th percentiles of VCMM distributions as of July 31, 2021, for the 10 years ending July 31, 2031. VCMM simulations use the MSCI US Broad Market Index for U.S. equities, the MSCI All Country World ex USA Index for global ex-U.S. equities, the Bloomberg U.S. Aggregate Bond Index for U.S. bonds, and the Bloomberg Global Aggregate ex-USD Index for ex-U.S. bonds. The 60/40 portfolio consists of 36% U.S. equities, 24% global ex-U.S. equities, 28% U.S. bonds, and 12% ex-U.S. bonds.
Joseph (Joe) H. Davis, Ph.D., is the Global Chief Economist of Vanguard, a sponsor of Firstlinks. Past performance is no guarantee of future returns. This article is for general information and does not consider the circumstances of any individual. The author thanks Ian Kresnak, CFA, for his invaluable contributions to this commentary.
For more articles and papers from Vanguard, please click here.
IMPORTANT: The projections and other information generated by the Vanguard Capital Markets Model® (VCMM) regarding the likelihood of various investment outcomes are hypothetical in nature, do not reflect actual investment results, and are not guarantees of future results. The distribution of return outcomes from the VCMM is derived from 10,000 simulations for each modeled asset class. Simulations for previous forecasts were as of September 30, 2010. Simulations for current forecasts are as of July 31, 2021. Results from the model may vary with each use and over time. For more information, refer to Vanguard's original publication linked here.