As we move through ‘peak virus’, our team has spent time reflecting on significant trigger points that might precipitate fundamental changes in future market sentiment.
In this note, we publish preliminary internal forecasts for the distribution of COVID-19 infections in the US and Australia focussing on the time intervals during which we are likely to observe a demonstrable reduction in infection rates after the application of more expansive testing and containment policies. We offer a range of scenarios, conditioning off the reaction functions in a number of different countries, including Italy, South Korea and China, with various discounts to proxy for inefficient or impaired containment in the US and Australia.
A clear deceleration in US infections and fatalities is likely to be a necessary condition for more constructive global market sentiment. We find that it is reasonable to expect US and Australian infection numbers to peak in early to mid-April with a decline evident 10 to 20 days thereafter, although there are risks to these forecasts.
There is also emerging evidence of a game-changer for the treatment of the COVID-19 disease and the observed fatality rates, which is the advent of an effective and cheap anti-viral drug that kills the virus in the form of hydroxychloroquine. This has been aggressively promoted by President Trump in recent days. We discuss this at some length at the conclusion of our forecasting analysis.
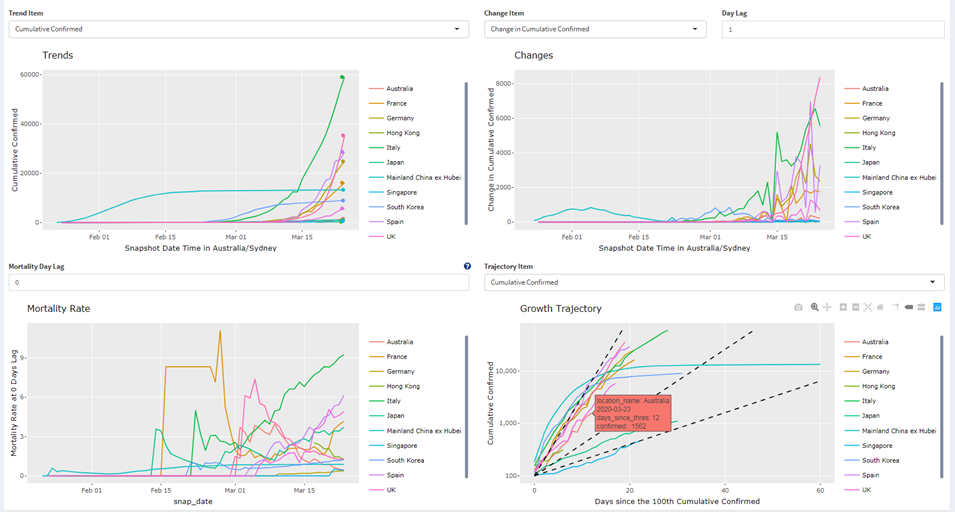
(The image above is a screenshot taken from our real-time global infection and fatality rate tracking system, which automatically updates every 15 minutes.)
1. Forecasting possible COVID-19 infection distributions
The objective is to forecast country (especially US) daily case counts, eventual case count, and time to peak daily new cases. This is done by first visualising the case growth trajectories, the changes in case growth rates over time, then modelling this growth rate and applying it for case forecasts.
1.1 Case growth trajectory
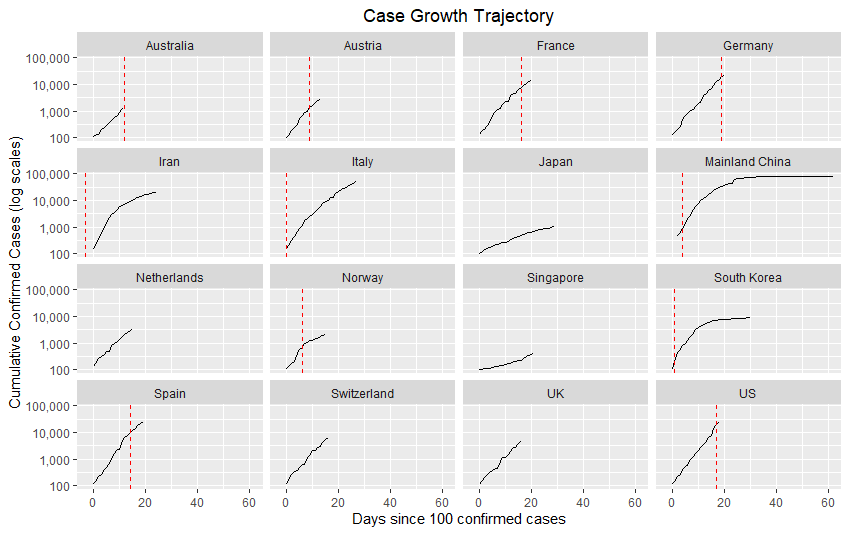
The first observation is that cumulative total confirmed case counts in countries around the world mostly follow an exponential growth curve, once the infection has taken hold within the country (arbitrarily defined as having at least 100 confirmed cases). See plot ‘Case Growth Trajectory’. A straight line on this plot, where the y axis is on a log scale, means we have exponential growth. Of course, government intervention can change the trajectory. In this plot, vertical dotted lines indicate the beginning of major intervention policies, defined as mass closures of services, or extremely comprehensive testing regime.
1.2 Evolution of the Case Growth Trajectory
Next we investigate the evolution of the above case growth trajectory. As seen above, the trajectories are rarely a single straight line. Most have a slight trend towards being a less steep line. Some appear to have bigger drops in steepness in response to intervention measures.
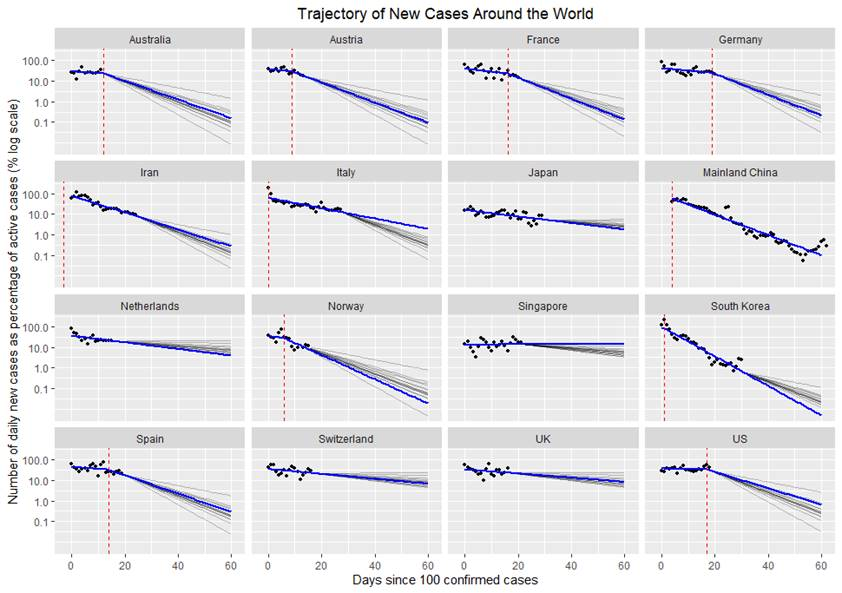
One measure of infection rate is the number of daily new cases as a percentage of the number of outstanding active (ie, infectious) cases. In the plot ‘Trajectory of New Cases Around the World’, we plot this against the days since 100 cases. We see that this percentage mostly holds constant in countries without intervention measures (eg, Australia and US), indicating unchecked exponential infection growth.
Countries with extreme intervention measures, such as China and South Korea, have a curve with steep negative slope, indicating the process of bringing the infection under control. There is visual suggestion that intervention measures reduce the slope of this line. Many European countries also exhibit a slightly negatively sloped line even before major interventions.
What is useful about this curve is that once plotted in this manner with the y axis in log domain, the curves appear piecewise linear. This allows the characterisation of countries’ trajectories via a single coefficient, that being the slope of the line in this plot. This allows us to do what-if analysis, by applying the coefficients of other countries (eg, countries with successful containment strategies such as South Korea) to countries still in the earlier stages of applying intervention (eg, the US).
In the plot below, blue lines are extrapolated from the country’s observed past data (eg, the US itself and the global average effect of interventions), while the grey lines are taken from applying the coefficient of other countries from today (eg, applying coefficients from South Korea, China, Italy etc to the US from today onwards).
For completeness, the curves below are all fitted via a linear mixed effect model, which includes fixed effects for global intercept, global slope for days since 100 cases, global slope for days since intervention, plus random effects for these mentioned variables (by country).
2. Forecast of cases
By utilising the trajectory evolution predictions from above, we can forecast case numbers. As a technical note, the above trajectory evolutions require an estimate of recoveries and deaths. This is estimated as the confirmed case count from 14 days ago, as the disease is known to run its course over roughly 14 days. Back-tests show this method is sufficient for its usage, as minor errors will not affect end results much.
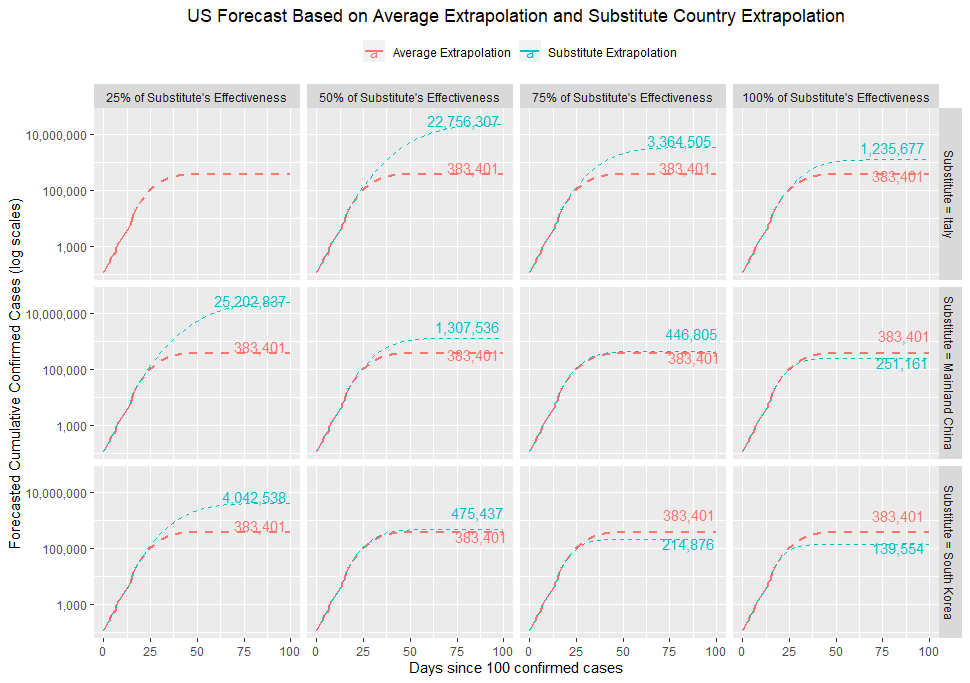
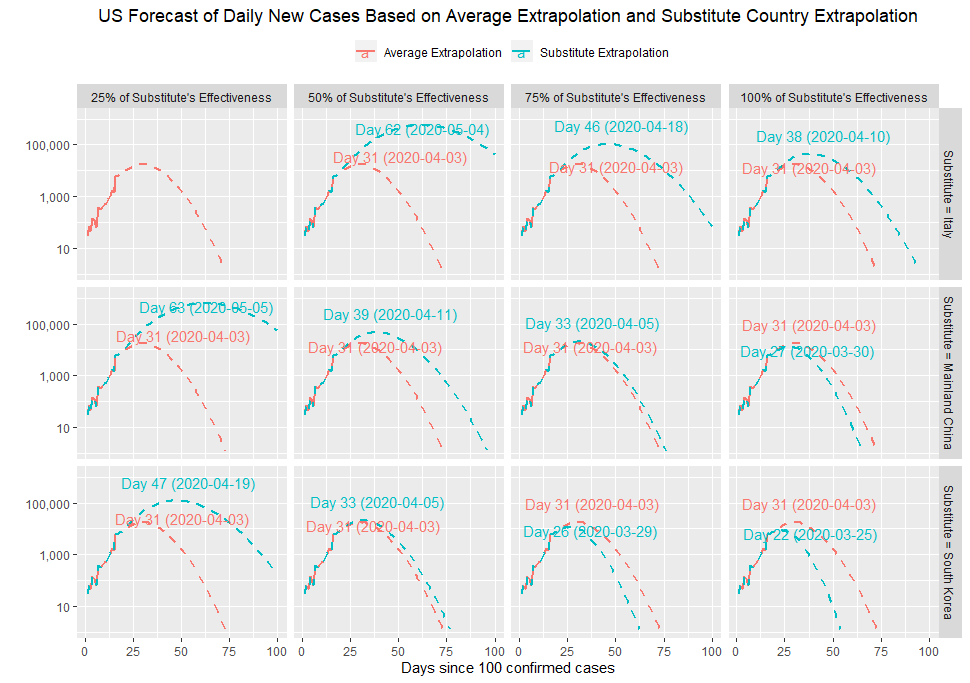
Below we plot the forecasted cumulative case counts for the US. One method (light red line) extrapolates off US trajectory curve and uses the global average effect of interventions on the trajectory. The second method (light blue lines) uses the trajectory evolution curves from substitute countries, such as Korea, China and Italy, at 25%, 50%, 75% and 100% of the substitute country’s effectiveness.
For example, the light blue line from bottom right corner shows that if the US has 100% of South Korea’s efficiency in driving down the case trajectory from today, there will be 139,600 cases eventually. Similarly, in the top right corner plot, the light blue line shows that if the US has 100% of Italy’s intervention response efficacy, the eventual case count would be around 1.2 million. Otherwise, if the US only has a global average effectiveness of intervention, then the eventual case count will be around 383,000. Note that dotted lines in the plot denotes projections.
The market is known to somewhat irrationally focus on the hump in daily new cases. We would, however, recommend viewing the data in the log domain as shown in Figure ‘Trajectory of New Cases Around the World’. However, for visual ease, we have also plotted the forecasted daily new cases. If the US has 100% of South Korea’s efficiency in driving down new cases, then the peak will be around March 25 (ie, very soon) and April 3 if at 50% efficiency. Similarly, if the US has 75%-100% of Italy’s efficiency, then the peak will be around mid-April.
3. Key forecast findings
In this exercise, we explored the infection trajectory of countries currently with the highest Covid-19 cases. We found that, in the log domain, the daily new cases as a percentage of outstanding cases form clear piece-wise linear trends. This facilitates the modelling of each countries’ case trajectories using linear coefficients, thus enabling the forecasting of cases, both based on each country’s own fitted trajectories with average global intervention effect, as well as via substituting in other countries’ trajectories.
For example, by substituting in the South Korea intervention response to the US trajectory to date, and conservatively taking a 50% reduction in efficiency compared to the South Koreans, the US is forecasted to experience peak daily new case count around April 5. A demonstrable decline in US infections should on this basis be observed by mid-April. Similarly, by substituting the Italian intervention response to the US trajectory to date, the forecast peak will arrive at around mid-April if we assume 75% to 100% of the Italian response’s efficacy. Again, a clearly declining trend in infections might only be evident by late April. Applying the same assumptions to a country like Australia, infection rates are likely to peak around early to mid-April with a decline in cases observed in the second half of the month.
Within our analysis and forecast of cases, we used the assumption that each country is a homogeneous entity, and that a single coefficient is used to model the trajectory of each nation’s case growth. One potential source of inaccuracy stemming from this is that if a country, such as the US, adopts interventions a few states at a time, as opposed to a coordinated nationwide effort, then the time to peak daily new case count could be substantially elongated. In this scenario, much like the game whack-a-mole, the US government may be making intervention decisions based on the goal of keeping the national daily case count manageable but constant until a vaccine is ready, in which case the time to peak daily case count may be, by construction, the time to a vaccine (eg, 12 months). This would be highly sub-optimal.
4. The game-changer: A near-term anti-viral solution?
In addition to a clear decline in infection and death rates, there are several other event risks that could impact market sentiment. Arguably one of the most interesting is the near-term availability of a tractable anti-viral solution.
It would appear that there are two cheap, publicly available, and scalable drugs that have existing FDA approvals for other purposes: chloroquine (C), which is an anti-malarial drug; and its much safer derivative, hydroxychloroquine (HC), which is used to treat auto-immune disease and arthritis.
Based on the available data, it would seem that HC in particular has a reasonable probability of being able to kill the virus in the first couple of weeks infection (before it has permanently damaged lung capacity and triggered an immune system response).
In recent days President Trump has actively promoted HC use in combination with an anti-biotic known as azithromycin or Z-Pak in his press conferences and online. The FDA has confirmed they are allowing US hospitals to employ HC and Z-Pak on a compassionate basis until formal FDA approval for COVID-19 use is secured, which is expected soon.
We do know that both C and HC kill the virus in vitro. A leading global infection disease expert working in French hospitals has published results of a non-randomised and relatively small clinical trial of his patients that has shown encouraging findings (see the paper here and a detailed video with the key author here). There is also this video interview with a US physician who is treating 100 patients with HC at an east coast hospital who claims they have had similar success with the drug and no fatalities.
It would appear that the Chinese figured some of this out in mid-February, and have since been prescribing C as a standard therapeutic for COVID-19 patients. A Wall Street Journal article published by two senior practicing doctors on 23 March provides a good summary:
A flash of potential good news from the front lines of the coronavirus pandemic: A treatment is showing promise. Doctors in France, South Korea and the U.S. are using an antimalarial drug known as hydroxychloroquine with success. We are physicians treating patients with Covid-19, and the therapy appears to be making a difference.
Hydroxychloroquine is a common generic drug used to treat lupus, arthritis and malaria. The medication, whose brand name is Plaquenil, is relatively safe, with the main side effect being stomach irritation, though it can cause echocardiogram and vision changes. In 2005, a Centers for Disease Control and Prevention study showed that chloroquine, an analogue, could block a virus from penetrating a cell if administered before exposure. If tissue had already been infected, the drug inhibited the virus.
On March 9 a team of researchers in China published results showing hydroxychloroquine was effective against the 2019 coronavirus in a test tube. The authors suggested a five-day, 12-pill treatment for Covid-19: two 200-milligram tablets twice a day on the first day followed by one tablet twice a day for four more days.
A more recent French study used the drug in combination with azithromycin. Most Americans know azithromycin as the brand name Zithromax Z-Pak, prescribed for upper respiratory infections. The Z-Pak alone doesn’t appear to help fight Covid-19, and the findings of combination treatment are preliminary.
But researchers in France treated a small number of patients with both hydroxychloroquine and a Z-Pak, and 100% of them were cured by day six of treatment. Compare that with 57.1% of patients treated with hydroxychloroquine alone, and 12.5% of patients who received neither.
What’s more, most patients cleared the virus in three to six days rather than the 20 days observed in China. That reduces the time a patient can spread the virus to others. One lesson that should inform the U.S. approach: Use this treatment cocktail early, and don’t wait until a patient is on a ventilator in the intensive-care unit.
A couple of careful studies of hydroxychloroquine are in progress, but the results may take weeks or longer. Infectious-disease experts are already using hydroxychloroquine clinically with some success. With our colleague Dr. Joe Brewer in Kansas City, Mo., we are using hydroxychloroquine in two ways: to treat patients and as prophylaxis to protect health-care workers from infection.
We had been using the protocol outlined in the research from China, but we’ve switched to the combination prescribed in the French study. Our patients appear to be showing fewer symptoms.
Our experience suggests that hydroxychloroquine, with or without a Z-Pak, should be a first-line treatment. Unfortunately, there is already a shortage of hydroxychloroquine. The federal government should immediately contract with generic manufacturers to ramp up production. Any stockpiles should be released.
There are probably several reasons why we have not heard more about HC until the last week or so. First, a national leader promoting HC as a cure would create a run on the drug, denying it to the sick suffering from lupus and other auto-immune diseases, and those with rheumatoid arthritis. This has already happened in Australia and the US following Trump’s advocacy. Second, even with scalable production capacity, it will take time to ramp-up. Encouragingly, this process has already started. One US journal reports:
Novartis has pledged a global donation of up to 130 million hydroxychloroquine tablets, pending regulatory approvals for COVID-19. Mylan is ramping up production at its West Virginia Facility with enough supplies to make 50 million tablets. Teva is donating 16 million tablets to hospitals around the U.S.
This brings us to a third insight, which is that you still need containment to flatten the infection curve and massively reduce reproduction rates, or ROs, ideally below 1.0, if you are to avoid mass infections within any given community. If national leaders start promoting cures, there is a risk that there will be widespread resistance to containment, massively increasing transmission rates, and the need for more drugs that may have capacity constraints.
Christopher Joye is Co-Chief Investment Officer and Kai Lin is a Senior Data Scientist at Coolabah Capital Investments (Smarter Money Investments). This article is general information and does not consider the circumstances of any investor.