Register For Our Mailing List

Register to receive our free weekly newsletter including editorials.

Home / 366

Six ratios show the market is off the charts

"As in all periods of speculation, men sought not to be persuaded by the reality of things but to find excuses for escaping into the new world of fantasy."

– John Kenneth Galbraith, The Great Crash 1929, published 1954

There is no limit to the number of financial charts an investor can follow. Data can be made to fit almost any hypothesis as analysts mine numbers to find unique insights. US academic, Campbell Harvey, has identified over 400 ‘factors’ that supposedly drive markets. His source is not an unknown trader with 20 screens in his garage. Harvey finds these well-researched factors in peer-reviewed papers appearing in leading financial journals, as described in ‘A Census of the Factor Zoo’. He says:

“Surely, many of them are false. We explore the incentives that lead to factor mining and explore reasons why many of the factors are simply lucky findings. The backtested results published in academic outlets are routinely cited to support commercial products. As a consequence, investors develop exaggerated expectations based on inflated backtested results and are then disappointed by the live trading experience.”

Recognised market measures are at extremes

With the qualification that charts can prove almost anything, the following selection is not drawn from obscure ratios and calculations, but the more accepted ways experts watch markets. At a time when stock markets are almost ignoring the economic slowdown caused by a global pandemic, even as bond markets throw out the warning signs, these ratios are at historical extremes.

1. The ratio of financial assets to GDP

Warren Buffett told Fortune Magazine in 2001 that if the ratio of the market value of financial assets to GDP (or GNP) rises rapidly, "you are playing with fire”. Buffett believed that over time, it should not be possible to build wealth faster than the growth of business or the economy. He said:

“The chart shows the market value of all publicly traded securities as a percentage of the country's business - that is, as a percentage of GNP ... it is probably the best single measure of where valuations stand at any given moment ... For investors to gain wealth at a rate that exceeds the growth of U.S. business, the percentage relationship line on the chart must keep going up and up ... That won't happen.”

Sorry, Warren, yes it will.

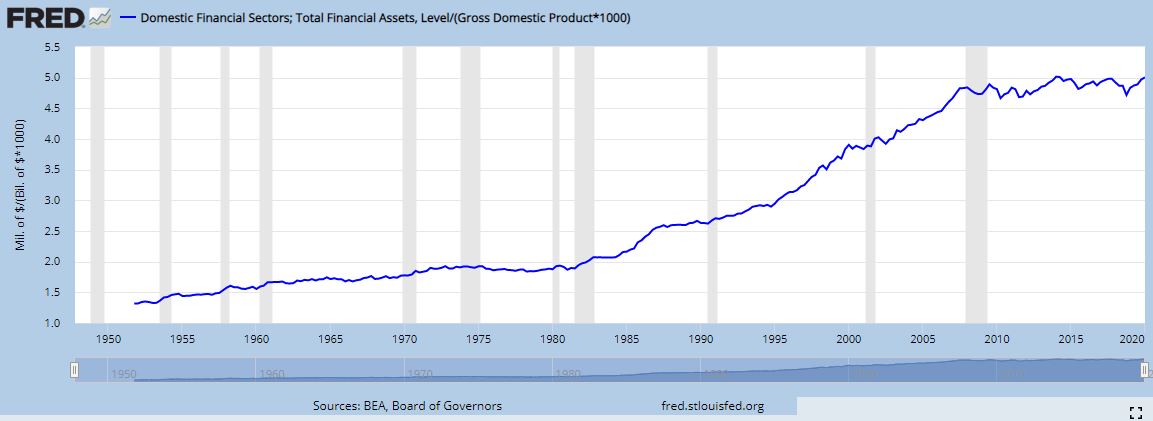
Policymakers have driven down interest rates, inflating the value of most investments. This is seen as a precursor to economic recovery as activity is stimulated, with Wall Street leading Main Street. But financial assets are now 5X US GDP when Buffett thought 2X was extreme. For a breakdown of inclusions in financial assets, see FRED Economic Data.

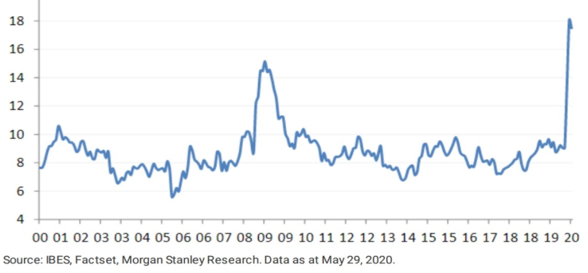
2. The dispersion of profit forecasts

From the thousands of stock analysts who dissect the results of companies and create complex spreadsheets of forecasts, there is usually a reasonable consensus. However, such is the uncertainty as companies withdraw guidance and analysts struggle to build in the impact of COVID-19 that the earnings per share estimates are at record high dispersion.

Top 200 listed companies in Australia, Earnings Per Share (EPS) Forecast Dispersion

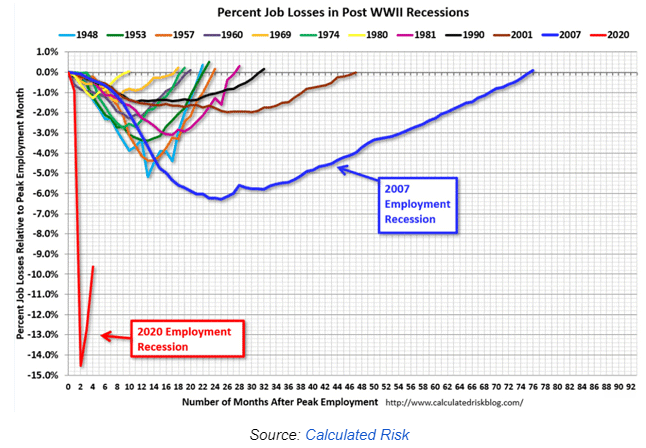
3. The size of jobs fall and time to recovery

In the 12 recessions in the US since the Second World War, the shape of the U- or V-shaped recovery has varied significantly. The following chart shows the percentage job losses relative to the prior peak in employment in the US. Jobs returning to previous levels has taken from only a few months to many years in the case of the 2007 employment recession.

The red line below shows the current pandemic. While it seems to have hit the bottom, it is a long way back when the virus continues to threaten (California represents 15% of US GDP and has gone back into lockdown this week). Many companies will never return. If the experience of 2007 is repeated where job creation took 76 months to recover, the US is looking to 2026 or 2027 to return to normal. That does not sound like much of a V, especially when about 33 million Americans are receiving unemployment payments, or 24% of workers, but the official unemployment rate is only 11%.

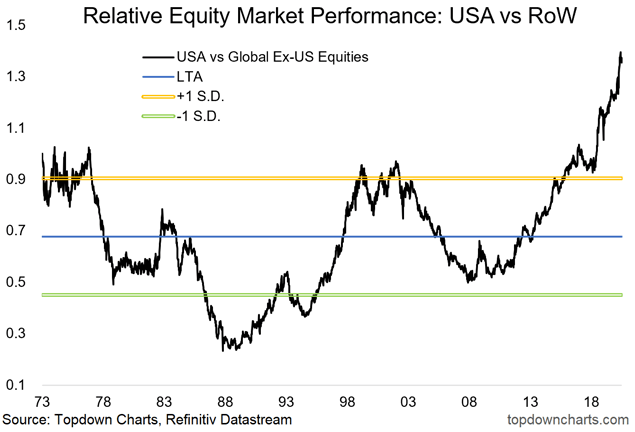
4. The value of US equities versus the rest of the world

We all know the incredible success of the large US technology companies such as Facebook, Apple, Amazon, Netflix and Microsoft. The top 5 companies now represent 25% of the market cap of the S&P500 (the largest concentration in 50 years) with the NASDAQ P/E ratio hitting 30 for the first time since 2004.

What is less well-known is the extent to which the US market has overwhelmingly outperformed the rest of the world. Most global equity managers not invested in the big US companies are having a torrid time against the global index. Those who made a convincing case to invest in the best from Asia or Europe or Less Developed Countries have been overshadowed by five or six excellent US companies.

Investing is about the future not the past, and many fund managers are now saying that the only value left in equities is outside the US. But who is game to bet against the NASDAQ tech story which just keeps running? According to analyst and commentator, John Mauldin:

“The last time the rest of the world was this consistently cheap vs US equities coincided with the peak in the previous big cycle of US vs global equities relative outperformance. Turning to valuations, the RoW index is just plain cheap versus USA stocks. It appears it is a matter of when, not if, global equities perk up vs US stocks. A remarkable 90% of countries offer better value than the US—a level bested briefly after the tech bubble in the early 2000s.”

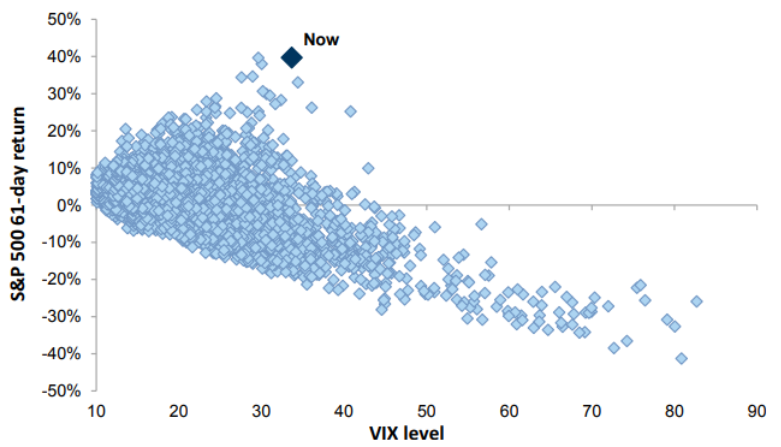
5. The volatility of equities after a market rally

The VIX Volatility Index is a measure of the level of risk or fear in equity markets. Traditionally, the ‘fear index’ moves inversely to the stock market. This has appealing logic: as prices rise, investors become more relaxed and VIX falls.

However, according to a report in Zerohedge, the VIX has never been this high after such a strong rally in the 61-day S&P500, as shown below. The chart indicates how the VIX becomes elevated when markets fall, with a big cluster of low volatility when the market rises. The current combination of high returns and high volatility is rare.

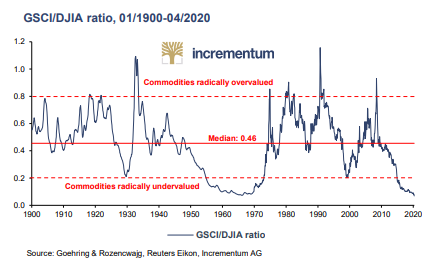
6. The performance of commodities relative to equities

A common measure of the performance of a wide range of commodities is the S&P GSCI (Goldman Sachs Commodities Index). It is a benchmark for investment in commodities and is a tradeable index equivalent to a stock index such as the S&P500 or Dow Jones Industrial Average (DJIA).

The ratio of the GSCI to DJIA is at its lowest level in 50 years and almost touches the 120-year record. According to the chart below, this places the index in the ‘commodities radically undervalued’ region. Of course, it is a ratio of one number to another, so it also means ‘equities radically overvalued’ relative to commodities. It’s even more surprising when the components of the GSCI are so varied:

“The index currently comprises 24 commodities from all commodity sectors - energy products, industrial metals, agricultural products, livestock products and precious metals. The wide range of constituent commodities provides the S&P GSCI with a high level of diversification, across subsectors and within each subsector.”

When markets are at extremes, something must give

While reversion to a mean can take many years, decades of well-known financial ratios will not remain at these new extremes forever. 

A common theme in five of the charts above is that equities are expensive, which makes the sixth chart of record job losses and a long recovery all the more important.

A foundational text on investing was written by Graham & Dodd in 1934, and it remains relevant today:

"Instead of judging the market price by established standards of value, the new era based its standards of value upon the market price. Hence, all upper limits disappeared, not only upon the price at which a stock could sell, but even upon the price at which it would deserve to sell."

– Benjamin Graham & David Dodd, Security Analysis, 1934


Graham Hand is Managing Editor of Firstlinks. This article is general information and does not consider the circumstances of any investor.


12 Comments
Philip Rix
July 17, 2020

I'm a big fan of Warren Buffett - but am not so sure he's got his logic for Chart 1 right. A possible explanation for the continued growth in the ratio (ie ratio of US stock value to US GDP) is that greater international expansion
(esp the "FAANG's") has meant many larger US companies are now generating an increasing share of earnings offshore versus what is generated by just the US economy?

SMSF Trustee
July 18, 2020

Philip, if they're doing that then it boosts the US economy. That GDP figures include company profits.

Jason
August 03, 2020

Agree, I think some companies these days almost need to be captured as “global” companies. Maybe it’s time for an International Stock Exchange?

kim
July 16, 2020

I think all that is the effects of large money printing.

Jeff Oughton
July 15, 2020

Be very careful - take out the FANGs effect and allow for much lower real interest rates and this story is story is very different.

my questions
1. is the tech/digitisation etc a big positive singularity expected to continue (or a bubble - and what will make it bust)?
2. why low real rates? and how long?

Warren Bird
July 15, 2020

We have low rates because we have a low risk free rate of return. The economy is simply not generating a sound return on financial assets, and thus the Wicksellian neutral rate of interest is extremely low.

We don't have low rates because Central Banks have fought the fundamentals and driven them to levels at which they shouldn't be.
We have low rates because Central Banks have reacted as endogenous agents within the system that the rest of us operate in (also endogenously, but not as well informed) and moved policy rates to where they are.

Does anybody seriously think that without structural, micro-economic reforms and significant improvement in growth prospects, Central Banks could lift rates to, what, 4% and that the economy would react by saying, 'yeah, that's fine, we can live with that?'

Monetary policy is about leading consumers and business to the shopping mall, but it can't force them to go in and buy something. Right now, business doesn't want to invest and consumers are reluctant to consume. That doesn't mean monetary policy has 'failed', it is just that at the zero interest limit the time has come for governments to borrow at near zero rates and do the spending for us, to kick start things again.

Tech and digitisation is a huge positive for earnings for those companies that use it well. one upside from COVID is that it's forced business to realise they don't need to fly their executives business class across the world to have a meeting. Costs come down. But that still is a backdrop for low interest rates.

DK
July 21, 2020

So the public sector goes into debt to prop up the private sector, which appears to be:
1. Unsustainable
2. Increasing the gap between the rich and the poor
3. Apparent failure of democracy (politicians only care about what happens between now and next election, meaning decisions are too short term focused).

Monetary and fiscal policy seem to be kicking the bucket down the road but how does this end?

Warren Bird
July 21, 2020

DK: responses to each of your observations -

1. Why? Low levels of debt funded at near zero rates
2. How? Most of the spending is going to low and middle income earners
3. Debatable at best, spurious - in fact in this crisis, I think the last thing on the political leaders' minds is the next election. I think there's a genuine desire to look after the well-being of people, now and for the long term.

How is any of this 'kicking the can down the road'? It's managing the shocks to the economy, as has always been the case with macroeconomic policy.

DK
July 23, 2020

Thanks Warren,
So what I've seen since the GFC is governments and central banks propping up a weak economy for an entire decade with little to no stimulus as seen with low inflation, low wages growth, increasing 'under' employment and low and even negative rates. Yes that's right: negative rates where people pay for the 'opportunity' to take on risk and lend money. What precedent have you got to provide you with such confidence?

Spending on middle and income earners does not result in economic growth but rather provides for basic human needs. All the while asset prices have been inflated (ie: more money for the rich being those that own the assets). If you asked any economist/government or banker if they are happy that the stimulus over the last decade provided the growth expected, what do you think they would say? Are you comfortable the economy/capitalisation/democracy and monetary/fiscal policy is working ok?

And finally, you have a lot more confidence in our political leaders than the average person!


A K Mani
July 15, 2020

I think we are again reaching the level of "Irrational Exuberence " , more so, when it comes to Tech stocks.

Steve
July 15, 2020

Is there a case to suggest that some of the NASDAQ companies are being priced in a similar way to the Nifty-Fifty of the late 60s/early 70s? No doubting the quality of the companies, as back then, only the current valuations.

Jack
July 15, 2020

When you allow for the fact that those great tech companies, the FANGs and Microsoft and Tesla and Invidia and Cisco, are all US companies listed in the US, then perhaps the value of that market above the ROW is justified.


Leave a Comment:


RELATED ARTICLES

After 30 years of investing, I prefer to skip this party

Citi’s Gofran Chowdhury: clients don’t think the worst is over

What will stop the market returning to its highs?

banner

Most viewed in recent weeks

2024/25 super thresholds – key changes and implications

The ATO has released all the superannuation rates and thresholds that will apply from 1 July 2024. Here's what’s changing and what’s not, and some key considerations and opportunities in the lead up to 30 June and beyond.

The greatest investor you’ve never heard of

Jim Simons has achieved breathtaking returns of 62% p.a. over 33 years, a track record like no other, yet he remains little known to the public. Here’s how he’s done it, and the lessons that can be applied to our own investing.

Five months on from cancer diagnosis

Life has radically shifted with my brain cancer, and I don’t know if it will ever be the same again. After decades of writing and a dozen years with Firstlinks, I still want to contribute, but exactly how and when I do that is unclear.

Is Australia ready for its population growth over the next decade?

Australia will have 3.7 million more people in a decade's time, though the growth won't be evenly distributed. Over 85s will see the fastest growth, while the number of younger people will barely rise. 

Welcome to Firstlinks Edition 552 with weekend update

Being rich is having a high-paying job and accumulating fancy houses and cars, while being wealthy is owning assets that provide passive income, as well as freedom and flexibility. Knowing the difference can reframe your life.

  • 21 March 2024

Why LICs may be close to bottoming

Investor disgust, consolidation, de-listings, price discounts, activist investors entering - it’s what typically happens at business cycle troughs, and it’s happening to LICs now. That may present a potential opportunity.

Latest Updates

Shares

20 US stocks to buy and hold forever

Recently, I compiled a list of ASX stocks that you could buy and hold forever. Here’s a follow-up list of US stocks that you could own indefinitely, including well-known names like Microsoft, as well as lesser-known gems.

The public servants demanding $3m super tax exemption

The $3 million super tax will capture retired, and soon to retire, public servants and politicians who are members of defined benefit superannuation schemes. Lobbying efforts for exemptions to the tax are intensifying.

Property

Baby Boomer housing needs

Baby boomers will account for a third of population growth between 2024 and 2029, making this generation the biggest age-related growth sector over this period. They will shape the housing market with their unique preferences.

SMSF strategies

Meg on SMSFs: When the first member of a couple dies

The surviving spouse has a lot to think about when a member of an SMSF dies. While it pays to understand the options quickly, often they’re best served by moving a little more slowly before making final decisions.

Shares

Small caps are compelling but not for the reasons you might think...

Your author prematurely advocated investing in small caps almost 12 months ago. Since then, the investment landscape has changed, and there are even more reasons to believe small caps are likely to outperform going forward.

Taxation

The mixed fortunes of tax reform in Australia, part 2

Since Federation, reforms to our tax system have proven difficult. Yet they're too important to leave in the too-hard basket, and here's a look at the key ingredients that make a tax reform exercise work, or not.

Investment strategies

8 ways that AI will impact how we invest

AI is affecting ever expanding fields of human activity, and the way we invest is no exception. Here's how investors, advisors and investment managers can better prepare to manage the opportunities and risks that come with AI.

Sponsors

Alliances

© 2024 Morningstar, Inc. All rights reserved.

Disclaimer
The data, research and opinions provided here are for information purposes; are not an offer to buy or sell a security; and are not warranted to be correct, complete or accurate. Morningstar, its affiliates, and third-party content providers are not responsible for any investment decisions, damages or losses resulting from, or related to, the data and analyses or their use. To the extent any content is general advice, it has been prepared for clients of Morningstar Australasia Pty Ltd (ABN: 95 090 665 544, AFSL: 240892), without reference to your financial objectives, situation or needs. For more information refer to our Financial Services Guide. You should consider the advice in light of these matters and if applicable, the relevant Product Disclosure Statement before making any decision to invest. Past performance does not necessarily indicate a financial product’s future performance. To obtain advice tailored to your situation, contact a professional financial adviser. Articles are current as at date of publication.
This website contains information and opinions provided by third parties. Inclusion of this information does not necessarily represent Morningstar’s positions, strategies or opinions and should not be considered an endorsement by Morningstar.