Register For Our Mailing List

Register to receive our free weekly newsletter including editorials.

Home / 126

State of play in listed real estate

Australian Real Estate Investment Trusts listed on the ASX (A-REITs) entered the August 2015 reporting season with a black cloud hanging over the global financial markets. During the course of that month, both the global and the A-REIT sector experienced a roller coaster ride and by the end, the heavens had opened and markets across the globe capitulated. So how has listed real estate performed recently and over time?

A-REIT performance

The A-REIT sector held up quite well and offered a relative safe haven amongst the market turmoil. Taking the global comparison first, in local currency terms, Australian A-REITs outperformed the global REIT index by 180bps (-4.1% vs -5.9%) (see Table 1). On both a year to date and one year basis, A-REITs have also done well compared to their global counterparts.

Table 1: Total Returns - Listed Real Estate (local currency): 31 August 2015

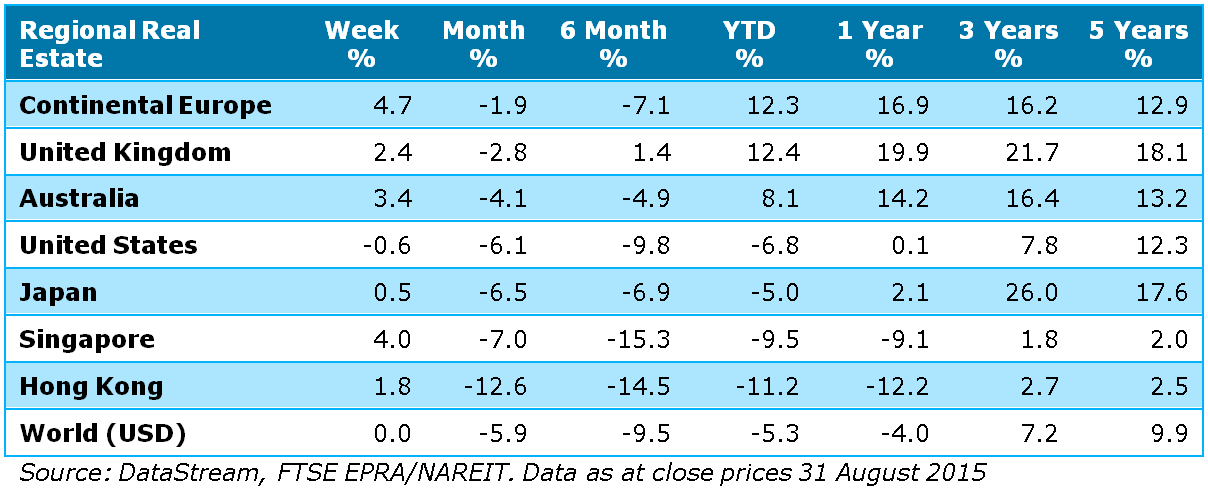
Turning to the domestic comparison relative to equities, A-REIT’s outperformed equities by 3.6% in August (-4.1% vs -7.7%), and over one year have outperformed equities by a massive 17.4% (14.2% vs -3.2%). Figure 1 shows there were few places to hide in the equity market sectors.

Figure 1: Total Returns – S&P/ASX300 Sectors: 31 August 2015
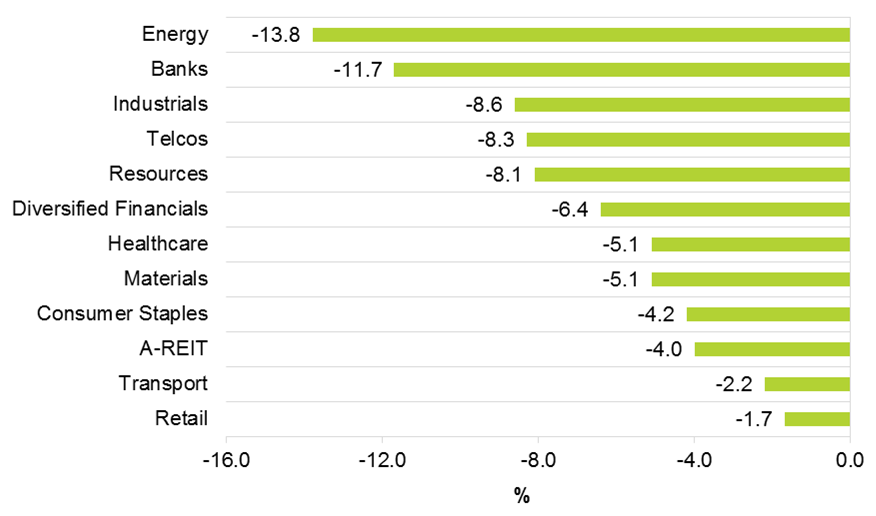
Source: Bloomberg

Despite posting two of the best results, the larger A-REITs in Stockland (-8.0%) and Mirvac (-7.4%) underperformed as investors focused on the growing headwinds in the residential sector. APRA investor lending controls, deteriorating affordability levels and Mirvac CEO’s frank assessment of where we are in residential cycle:

Previous cycles would suggest that activity, i.e., volume of sales, should moderate over the next year or two by 15%. Importantly, we don't believe this will lead to price falls, but rather we expect price growth to moderate away from the high double-digit growth rate that it's been experiencing in recent years.”

A positive for the sector was the move by many of the A-REITs to follow the Property Council’s Guidelines for Reporting and adopt Funds from Operations (FFO) to more closely align the underlying cashflow generated by the business with reported earnings. It has long been a frustration that there were so many inconsistencies across A-REITs particularly in relation to their treatment of tenant incentives (which for the office A-REITs remain elevated), trading profits and lost rent on developments to name a few.

Dividends and revaluation rates

In an environment where investors are focused on sustainable earnings and income, the A-REIT sector’s dividend remains sound. As Figure 2 shows the dividend yield is cash covered, even after adjusting for cash received from trading activities which are typically one-offs.

Figure 2: Reconciliation between NPAT and Dividend Paid - FY15 ($Abn)

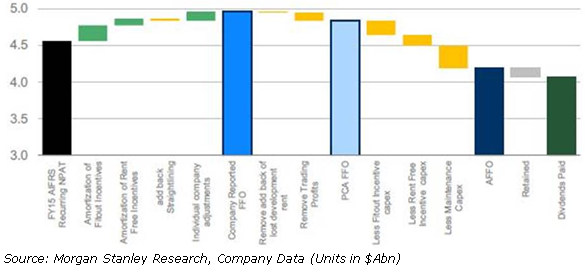
As Morgan Stanley’s Research team point out, the A-REIT sector:

“… currently retains enough capital to fund ongoing capex requirements - despite an increase in the number of stocks supporting dividends via non-recurring profits (eg, trading profits) … FFO/DPS growth is likely to remain smooth and sustainable for the majority of A-REITs as the debt cost lever is likely to offset cyclical weakness in operating conditions or the year-on-year impact from trading profits.”

At the asset level, retail and industrial assets performed well with specialty retail sales growth stronger than it has been in years. Income growth from the office sector was the one negative, with rising tenant incentives offsetting FFO growth. Strong demand for real estate assets has driven cap rate compression, although there still appears to be a lag between A-REIT cap rates and recent market evidence (the Chinese sovereign wealth fund, Chinese Investment Corporation’s $2.45bn acquisition of the Investa office portfolio on a 5% yield and Ascendas, a Singaporean REIT’s, $1.1bn acquisition of the GIC industrial on a sharp yield of 6%). This should support further increases in the carrying value of A-REIT assets in the year ahead.

Memories of the GFC remain

Capital management remains high on the agenda for both the A-REITs and investors. The GFC may have been seven years ago but fortunately memories still remain. Across the board, capital management is much better now and A-REIT’s balance sheets are in a stronger position. With record low interest rates, the A-REITs have not been tempted to increase gearing (with some exceptions such as Cromwell following its acquisition of the Valad Europe funds management platform). In fact, the A-REIT sector’s gearing fell almost 2% in the past year to circa 30%. At the same time, a number of the A-REITs took advantage of the yield curve to blend and extend their interest rate costs. Lower debt costs will continue to be a key earnings driver in FY16.

M&A activity could prove a positive catalyst for A-REITs in the year ahead. Rising asset values, historically low interest rates and intense competition for assets means that A-REITs will find it increasingly difficult to grow organically.

After the sell-off in August, the valuation of A-REITs looks more attractive. At the end of August 2015, the sector was trading on a FY15 cumulatively-adjusted EPS/DPS yield of 6.4%/5.3%, a healthy premium to bank bill rates (yielding around 2.2%) and 10-year bonds (2.7%). This is above the average distribution spread over the past ten years, normally less than 2%. The sector was trading on a 3% discount to Net Asset Value and a 27% premium to Net Tangible Assets (in fact, most funds are trading at a premium to NTA). Given the number of stapled securities in the sector who have funds management and development platforms that are not captured in the NTA, the NTA as a measure is becoming less relevant.

Stock selection as always remains key. Quality management and portfolios, together with conservative balance sheets and sustainable earnings growth, are fundamental, especially with financial market volatility expected to continue.


Adrian Harrington is Head of Funds Management at Folkestone Limited (ASX:FLK). This article is for general information only and does not take individual investment objectives into account.


2 Comments
Adrian Harrington
September 14, 2015

Gary
Thanks for the question. However, as I mentioned the NTA is becoming less relevant as a measure due to the stated NTA:
1. being a lagging factor - we believe that based on transaction evidence in the 2nd half of the year, there is further scope for cap rate compression (assets values increase) as valuers tend to lag the market. This should see the NTA move higher in the coming year and potentially reduce the premium to NTA;
2. does not indicate the value of the business earnings which are a growing part of the sector - for instance, residential property is held at the lower of cost or net realisable value. Businesses such as funds management operations also typically do not have a significant tangible value attached to them. In the case of
purchased businesses there is often an intangible value held in a stapled security’s balance sheet whereas an organically grown business is not
recognised in intangibles. The earnings from non-rental income is circa 10% but significantly higher in vehicles such as Westfield, Goodman Group, Charter Hall, Mirvac and Stockland.
3. is a sum of the individual property valuations and does not pick-up on the value of diversification of the portfolio and the management quality.

The bigger cap A-REITs like Westfield and Goodman which have very active development books and in the case of Goodman, large funds management platforms, are trading at 75% and 66% premiums to NTA. The market tends to focus more on the earnings multiples to value these A-REITs.

Having said that, looking at the trend graph in premium or discounts to NTA can give a good guide to the market - currently at circa 27% it is well below the circa 80% premium to NTA recorded just prior to the GFC but is well above the circa 40% discount to NTA recorded in the depths of the GFC.

The NTA is still quite worthwhile looking at for externally managed A-REITs like Charter Hall Retail and BWP Trust (which owns Bunnings) - the former is trading at a 9.2% premium to NTA and the latter is at 35% premium. Notwithstanding the premium the direct market buyers a paying for freestanding Bunnings in the open market - average cap rates now in the mid 6.0%'s and average cap rate on BWP assets in their book is circa 7.0% so there is scope for the NTA to increase however at current prices it implies the assets should be valued in their book on an implied cap rate of 5.5% (to get the price to equal NTA) - so on this measure BWP looks expensive.

Gary M
September 11, 2015

I am an investor in A REITS and I confess I didn't realise the massive difference between Net Asset Value and Net Tangible Assets. What are the implications of this - the sector looks overvalued on NTA?


Leave a Comment:

RELATED ARTICLES

The case for active management in A-REITs

A-REITs: what the market gloom is missing

A-REITS are looking at M&A activity again

banner

Most viewed in recent weeks

Raising the GST to 15%

Treasurer Jim Chalmers aims to tackle tax reform but faces challenges. Previous reviews struggled due to political sensitivities, highlighting the need for comprehensive and politically feasible change.

7 examples of how the new super tax will be calculated

You've no doubt heard about Division 296. These case studies show what people at various levels above the $3 million threshold might need to pay the ATO, with examples ranging from under $500 to more than $35,000.

Are franking credits hurting Australia’s economy?

Business investment and per capita GDP have languished over the past decade and the Labor Government is conducting inquiries to find out why. Franking credits should be part of the debate about our stalling economy.

Here's what should replace the $3 million super tax

With Div. 296 looming, is there a smarter way to tax superannuation? This proposes a fairer, income-linked alternative that respects compounding, ensures predictability, and avoids taxing unrealised capital gains. 

The rubbery numbers behind super tax concessions

In selling the super tax, Labor has repeated Treasury claims of there being $50 billion in super tax concessions annually, mostly flowing to high-income earners. This figure is vastly overstated.

9 winning investment strategies

There are many ways to invest in stocks, but some strategies are more effective than others. Here are nine tried and tested investment approaches - choosing one of these can improve your chances of reaching your financial goals.

Latest Updates

Taxation

100 Aussies: seven charts on who earns, pays, and owns

The Labor government is talking up tax reform to lift Australia’s ailing economic growth. Before any changes are made, it’s important to know who pays tax, who owns assets, and how much people have in their super for retirement.

7 key charts on the state of the Australian property market

The Australian property market stirs fierce debate - often bullish optimism versus crash predictions. But beyond the noise, seven charts reveal what's really driving prices and the outlook for residential real estate.

A simple alternative to the $3 million super tax

Division 296 aims to introduce improved fairness into the superannuation system, yet is overly complex. This scours the world for better ideas and suggests a simpler alternative which can achieve the same goals.

CBA and the index conundrum for super funds

After the hyperbolic rise in CBA shares, super funds are floating the idea of carving out the weightings of ASX bank securities and indexing them within their portfolios. This looks at why that might be a big error.

Strategy

10 policies to drive Australian productivity higher

Here's a comprehensive list of proposed reforms to fix Australia's stagnating economy, including introducing a flat income tax rate, reducing migration, and making childcare tax-deductible.

Interviews

Where to find big winners in Asia

As more money looks for a home outside the US, Asia may soon get some love. Fidelity's Anthony Srom outlines the best places in Asia to invest, including in Chinese consumer names, Indian financials, and Thailand.

Investment strategies

We have trouble understanding the time value of money

We overvalue the present and underestimate the future - it’s a cognitive glitch called hyperbolic discounting. It affects savings, spending, and loans, and it's more common - and costly - than we think. 

Sponsors

Alliances

© 2025 Morningstar, Inc. All rights reserved.

Disclaimer
The data, research and opinions provided here are for information purposes; are not an offer to buy or sell a security; and are not warranted to be correct, complete or accurate. Morningstar, its affiliates, and third-party content providers are not responsible for any investment decisions, damages or losses resulting from, or related to, the data and analyses or their use. To the extent any content is general advice, it has been prepared for clients of Morningstar Australasia Pty Ltd (ABN: 95 090 665 544, AFSL: 240892), without reference to your financial objectives, situation or needs. For more information refer to our Financial Services Guide. You should consider the advice in light of these matters and if applicable, the relevant Product Disclosure Statement before making any decision to invest. Past performance does not necessarily indicate a financial product’s future performance. To obtain advice tailored to your situation, contact a professional financial adviser. Articles are current as at date of publication.
This website contains information and opinions provided by third parties. Inclusion of this information does not necessarily represent Morningstar’s positions, strategies or opinions and should not be considered an endorsement by Morningstar.