Register For Our Mailing List

Register to receive our free weekly newsletter including editorials.

Home / 269

Aussie shares: 50 years and we’re finally ahead

Over the past few weeks the media have been getting excited about the local stock market hitting ’10-year highs’. It is true, but only because 10 years ago the market was falling like a stone in the sub-prime crisis. The All Ordinaries index is still 7% below its pre-GFC peak. It will get there soon enough but Australia will be one of the last countries to do so.

Denmark won the gold medal for the first country to surpass its pre-GFC peak way back in January 2013. The US was second in March 2013. The UK took bronze in May 2013. Dozens of other countries have done it since then, but we are still waiting. Why? Australia has been slow to recover because our 2003-2007 boom was bigger than most. Not only did we have a credit boom like the rest of the world, we had a mining boom as well. The bigger the boom, the bigger the bust that follows it.

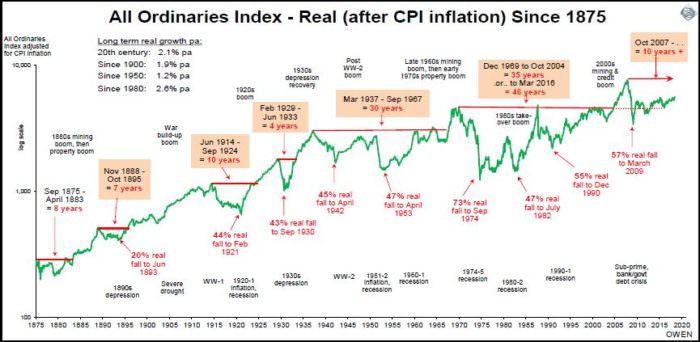
Need to think in real terms

More importantly, in real terms (after inflation) the All Ordinaries index is still 27% below its 2007 peak. People who bought in at the top of the boom - which unfortunately was many first-time investors lured in by frenzied media and by the ‘$1 million super contribution window’ - will have to wait a few more years to get back to square one after adjusting for inflation. Dividends add to returns, of course, but we want to see the real capital value of shares, or real wealth, rising not falling.

Am I being too negative by adjusting for inflation? No, because we need to adjust for inflation to measure the real value or spending power of our money. Inflation is everything. If I were to tell you that the Venezuelan stock market index is up by a whopping 6,976% so far this year (it is), would you race in to get some of the action, or would you run the other way? Now if I were to add that the inflation rate in Venezuela is running at 46,000% (it is), you would see that the real value after inflation is a train wreck.

Inflation can cripple real returns for decades. For people who follow the traditional ‘buy and hold’, ‘set and forget’ approach to investing, it is sobering to see that the broad market index in Australia (the All Ordinaries and its predecessors) is just 24% higher than where it was 50 years ago in August 1968. The market hit a mini-high on 16 August 1968, and then went on to peak at the end of 1969 at the top of the nickel boom, which also lured in many thousands of first-time investors. It promptly crashed and took 46 years to finally get ahead, in March 2016.

Click to enlarge

Share prices of our biggest companies have done little for 50 years

The companies that dominated the index in 1968 are mostly the same old companies that still dominate today. Let’s take the largest bank. Bank of NSW, now called Westpac, was $7.56 which is $2.18 adjusted for capital structure changes and $26.82 after inflation. It was $29.46 at the end of July 2018, a real gain of just 0.1% per year for 50 years! ANZ and NAB are still below their share prices 50 years ago, adjusted for capital structure changes and inflation. BHP is ahead by just 1.7% pa, Woodside is ahead by 1.5% pa. AGL is the best of the bunch, up by +3.6% pa over the 50 years, but CRA (now RIO), Santos, QBE and Lend Lease are all still below.

This is just the big ‘blue chip’ stocks. Unfortunately, in the booms people chase the speculative ‘hot’ stocks, which mostly end up worthless.

This is a sobering reminder of the destructive effect of inflation, and also a reminder not to get caught up in boom-time media frenzies that lure people in at the worst time. ‘Buy and hold’, ‘set and forget’ only works if you have 50 years to wait to get your money back.

It is also a reminder that GFC-type crashes are not unusual at all, contrary to the media nonsense that the GFC was a ‘once in a century’ event. The good news is that there are tremendous gains to be made by going against the herd and buying when everybody else is panic-selling in the busts.


Ashley Owen is Chief Investment Officer at advisory firm Stanford Brown and The Lunar Group. He is also a Director of Third Link Investment Managers, a fund that supports Australian charities. This article is general information that does not consider the circumstances of any individual.


15 Comments
Rob Palandri
November 08, 2020

Ashley Owen's article is the most common sense i have read for a very long time about the stockmarket.
I could not believe that there are supposed experts touting that the ASX shares made an average return of 13.1% per annum over the last 100 years or so.Complete nonsense and marketing spin.
That number assumes an investor invests an amount of money each year, say for simplicity 1st July and gets out of the market each year at its high point or at the least lowest point each year.Then start again and so on each year.
Averaging each year from 1st July to 30th June (year following, % up or down) over a number of years, then adding up those numbers and dividing by the number of years being reviewed is just nonsense and means nothing.

Its like adding up the 22 numbers on the back of the AFL players guernsey's in a team of the 22 players on the field and dividing by 22 to give an average number which is totally meaningless.It does not relate to actual performance on the field.

No investor has the ability to go in and out of markets at the high and least low points, and generally invests over a period.

Take the example of Westpac.WBC
An investor investing in Westpac on the 1st of July 2007 would have paid $25.24
If he was really smart he would have exited on 2nd April, 2015 at $38.81....not a bad return over about 8 years of just over 5% cumulative per annum + dividends.
However if that same investor held that share on 9th of November 2020....more than 13 years later its worth $17.76
A significant loss.
Trying to average the annual growth of a stock market index is totally ridiculous, misleading and dishonest.
According to those experts theory with an annual 13.1% growth Westpac shares bought at $25.24 in July 2007 should be trading at $144.85 in June 2020....plus dividends, but they are trading at $17.76
I am not a mathematician and nor are the experts

Rob Palandri


Peter Thornhill
September 02, 2018

Oh dear, here we go again. As the bulk of the return from quality shares comes from the cash flow, dividends, and NOT from share price movements I struggle to understand why talking about the index movements gets any oxygen.
A cursory look at some of our shares was, whilst not surprising, certainly a source of some comfort.
The following shows the dividend performance over the related time frame. We didn't get really serious about investing until the late nineties so the results are all substantially less than '50 years'.

Company Date investment Percentage of purchase price
commenced returned by dividends
CCP 2000 185%
CBA 1999 180%
CSL 2002 96%
DLX 2010 60%
EVT 2000 120%
MFG 2012 78%
WOW 2000 183%

The standout would be Cochlear which we fortuitously purchased as result of the float out of Pacific Dunlop in 1995. Dividends have returned just under 200% of what we paid.

I acknowledge that the above are good looking examples however, if I look at the portfolio in its entirety, including everything that went belly up, the result over the last 30 years is still a not too shabby 58%. Despite my worst efforts as an unqualified amateur, I'm comfortable that we will have more than 100% overall return from dividends alone at the 50 year mark.

J.P.
August 31, 2018

The problems you mentioned (reinvesting at a slightly different price point, brokerage costs, spreads, etc), would produce a far lower error when showing profits in terms of total return than leaving out the entire dividend when the dividend are an extra 2% over international dividends (about a 25% higher total return), and another 2% further for the banks which you used in your example.

Leaving out the dividends is like pro-shares people leaving out the enormity of leverage when comparing results of shares to property investing, or pro-property people leaving out franking credits and the huge holding costs of property when comparing shares to property investing. It paints a misleading picture when fundamental things are left out.

Daniel
August 31, 2018

What I take out of this is that exposure to domestic market should part of a broader asset allocation strategy. There has been a clear opportunity cost, not to mention increased risk, from having a portfolio comprise of TD's and the rest large cap Aus equities. Unfortunately this is the reality for many SMSF's run by unadvised Trustees who convince themselves they know better than reputable professionals because they read the Australian and listen to the Kohler Report. A careful review of the evidence would probably suggest otherwise. Biases and overconfidence in one's abilities have consequences. If you are willing to forego superior risk/adjusted returns for 'feel good factor' of being in control then so be it but you should be acutely aware of this and accept the trade-of.

At the end of the day, Oz represents less than 2% of the global market and is concentrated in two increasingly vulnerable sectors. Miners at the behest of commodity prices and banks at the mercy of credit growth and borrowers continued willingness to gorge on unsustainable amounts of debt to buy and sell overpriced properties off each other.

Moral of the story is it pays to both diversify across asset classes and look beyond our borders for opportunities.

ashley
August 30, 2018

on the issue of accumulation (total return) indexes there are numerous problems
- they assume investors receive cash dividends on the day the stock goes ex-div (in real life there are delays of weeks to months in many cases like property trusts)
- they assume investors immediately re-invest to buy more shares with the cash they theoretically received on the ex-div day (not possible in practice unless you use extra cash to buy on the ex-div day then repay it when the cash div arrives. If they use extra cash to buy on the ex-div day they they should deduct the opportunity cost (interest) of the extra cash)
- they assume investors pay no brokerage on the reinvestment (in practice there is brokerage cost + GST)
- they assume investors pay no spreads on the reinvestment
- they assume investors pay the closing price on the ex-div day. (in practice they get a a price some time during the day - which is rarely ever the closing price)
- they assume the amount of the dividend buys a whole number of new shares (in practice there is always a some cash left over - so the total return calculation should include interest income on the excess cash). This is an issue with high priced shares like CSL, CQG, and in the US many hundreds of shares trade at prices above $100 per share.
- they don't account for share price discounts in DRPs

For valuing franking credits there is the added problem that the franking credit adjusted indexes assume investors receive their cash tax refund on the ex-div day and then reinvest it in buying in cash with no brokerage or spreads, etc.
But in practice the cash refund is usually around 12 months later at best - eg a dividend paid in August 2018 after the June 2017-8 financial year result would be included in the tax return for the 2018-9 year, and even if they lodged their tax return in record time got a speedy refund the cash refund would not be received until say September 2019 or so. During the intervening 12+ months the share price may be significantly higher (depressing total returns) or lower (boosting total returns).

For all of these reasons - in practice I usually discount the value of the franking credits to allow for this 12 month+ delay - depending on the tax situation of each client.

But despite all of these issues, the raw total returns indexes and franking credit adjusted indexes are still useful starting points for the best case estimates of total returns.

cheers

ashley

SMSF Trustee
August 31, 2018

The timing of cash payments and reinvestment is a source of mismatch between the return of an accumulation index and the outcome in reality. But don't overplay it. Dividend yields are quite low, so the contribution to return from the timing issue is pretty small.

There are also tools to manage it - eg use futures to get back into the market pending receiving the cash payment.

Heaps of index fund managers are able to replicate the return of the accumulation index quite easily. So it's not as big a deal as you're making out.

Les
September 04, 2018

Thanks Ashley the devil is in the detail with performance measures you are obviously a little more expert than most of us in the field.

The basic point of your article which is that some large blue chip company share prices have not moved in 50 years in real is quite enlightening and probably very surprising to most people including.me. So thank you!

ashley
August 30, 2018

hi folks,
I have written dozens of articles and research papers about Australian shares over the years. There are a variety of different measures used depending on the context - price, total returns, before/after franking credits, fundamental indexes, real, nominal, etc, etc.

On the value of franking credits - for taxpayers who had enough other income to use the franking credits fully from 1988, the franking credits have added an average of 1.7% per year to their total returns from the broad Australian stock market. Best was 2.9% in 1989 and lowest 1.1% in 1993. Eg. see:
https://cuffelinks.com.au/labors-new-policy-denying-excess-franking-credits/
This is based on S&P's ASX 200 Franking Credit Adjusted Annual Total Return Index (Tax-Exempt) (Ticker: SPAX2F0).
However readers are free to use their own alternative facts.

On the issue of total returns including reinvested dividends - see
https://cuffelinks.com.au/shares-long-term-safe-haven/
and
https://cuffelinks.com.au/us-will-fall-australia-next-bust/
and many others

On the issue of why Australian dividend yields are so high - see: https://cuffelinks.com.au/dividend-yields-australia-high/


cheers
ashley

Michael 2
September 02, 2018

Interesting links, thank you

Graham Hand
August 30, 2018

Hi Mark, Ashley is big enough to speak for himself, but he does explain why he uses a Price Index in this chart. It's also not true that everyone uses an Accumulation Index. Usually, the All Ords and ASX200 or ASX300 are quoted as a price index. In fact, most people would not have a clue of the current level of the S&P/ASX200 Accumulation Index of around 65,000.

Mark Hayden
August 30, 2018

The Accumulation Index should be used. Every prudent investment analyst, or commentator, must include dividends.

John
August 30, 2018

Would be good to see to the accumulation index versus CPI and also bank bills. The main point that outperformance is often less than advertised is valid though.

Les
August 30, 2018

It would be interesting to see the return for the whole index over this time period (including dividends) assuming that dividends were reinvested in the index and perhaps for arguments sake that the franking credit and superannuation regimes were in place for the whole period and the investment was held at a 15% tax rate.

I think the returns would make investment managers weep and that's before you consider fees and risk.

J.P.
August 28, 2018

"Dividends add to returns, of course, but we want to see the real capital value of shares, or real wealth, rising not falling."

In a previous article on cuffelinks, there was a graph showing the 100+ year "total" returns for Australia and the US were pretty much the same. Total returns of about 10% annualised.

In the US, they've paid out about 2% as dividends and 8% as growth.
In Australia due to franking, investors demand more dividends, so it's around 4% dividends and 6% growth.

Obviously the VALUE of the underlying investment will be lower (grow slower and recover slower), when a higher proportion is taken out and paid to investors and used instead of re-invested. The investor has the opportunity to buy more shares as a way to re-invest as to the proportion reinvested that they want.


> a gain of just 0.1% per year for 50 years!

You do it again saying the banks grew by 0.1% annualised real. The banks currently payout dividends of around 6%, which is 4% on top of your comparison to markets around the world. 4% real return is certainly nothing to scoff at and shows your point is wrong.

If one wanted to be write an unbiased article, use an accumulation index when comparing to the non Australian markets.

SMSF Trustee
August 28, 2018

For goodness sake, the GFC was not primarily about the sharemarket! The sharemarket fall in 2008 was that asset class responding to an event that was much more far reaching. It's reaction might not have been a 'once in a century' magnitude sell-off, but there are other asset classes!

The corporate bond market experienced easily a once in a century event. Credit spreads widened to more than double the level they typically blow out to during severe economic downturns. Credit markets locked up and became almost impossible to trade at times during 2008.

There was also an outsized impact on land values. According the Philip Soos database of Australian land values, which goes back to 1910, the GFC saw outright declines in average land values - something that has only happened 3 times in the 100 years of the database. (OK so not 'once in a hundred years', but not as common place as share market volatility.)

Ashley, you're not the only commentator to have been dismissive of the GFC as a significant event because you focus on how it affected the sharemarket. But let's remind ourselves what the GFC actually was all about:

The GFC was about the very existence of the banking system.
The GFC was about trust right across the economy.
The GFC was about whether you could go down to the ATM and withdraw any cash or if your bank had gone out of business.

That's why governments all around the world guaranteed deposits. That's why central banks all around the world pumped liquidity into their banking systems. That's why policy interest rates fell to zero and have only just started to move back up in the US after nearly a decade.

The GFC was most definitely a 'once in a 100 year event', with consequences across the board not seen since the Great Depression.

It also annoys me no end when I read analysts forecasting 'another GFC' in the near term, when what they really mean is that they're forecasting a decent bear market in stocks. The egocentricity of equity market analysts knows no bounds!


Leave a Comment:

RELATED ARTICLES

The ASX's 16-year drought: a rebuttal

Get real: how we delude ourselves about investments

Hold the champagne, that’s not a recovery yet

banner

Most viewed in recent weeks

2024/25 super thresholds – key changes and implications

The ATO has released all the superannuation rates and thresholds that will apply from 1 July 2024. Here's what’s changing and what’s not, and some key considerations and opportunities in the lead up to 30 June and beyond.

The greatest investor you’ve never heard of

Jim Simons has achieved breathtaking returns of 62% p.a. over 33 years, a track record like no other, yet he remains little known to the public. Here’s how he’s done it, and the lessons that can be applied to our own investing.

Five months on from cancer diagnosis

Life has radically shifted with my brain cancer, and I don’t know if it will ever be the same again. After decades of writing and a dozen years with Firstlinks, I still want to contribute, but exactly how and when I do that is unclear.

Is Australia ready for its population growth over the next decade?

Australia will have 3.7 million more people in a decade's time, though the growth won't be evenly distributed. Over 85s will see the fastest growth, while the number of younger people will barely rise. 

Welcome to Firstlinks Edition 552 with weekend update

Being rich is having a high-paying job and accumulating fancy houses and cars, while being wealthy is owning assets that provide passive income, as well as freedom and flexibility. Knowing the difference can reframe your life.

  • 21 March 2024

Why LICs may be close to bottoming

Investor disgust, consolidation, de-listings, price discounts, activist investors entering - it’s what typically happens at business cycle troughs, and it’s happening to LICs now. That may present a potential opportunity.

Latest Updates

Shares

20 US stocks to buy and hold forever

Recently, I compiled a list of ASX stocks that you could buy and hold forever. Here’s a follow-up list of US stocks that you could own indefinitely, including well-known names like Microsoft, as well as lesser-known gems.

The public servants demanding $3m super tax exemption

The $3 million super tax will capture retired, and soon to retire, public servants and politicians who are members of defined benefit superannuation schemes. Lobbying efforts for exemptions to the tax are intensifying.

Property

Baby Boomer housing needs

Baby boomers will account for a third of population growth between 2024 and 2029, making this generation the biggest age-related growth sector over this period. They will shape the housing market with their unique preferences.

SMSF strategies

Meg on SMSFs: When the first member of a couple dies

The surviving spouse has a lot to think about when a member of an SMSF dies. While it pays to understand the options quickly, often they’re best served by moving a little more slowly before making final decisions.

Shares

Small caps are compelling but not for the reasons you might think...

Your author prematurely advocated investing in small caps almost 12 months ago. Since then, the investment landscape has changed, and there are even more reasons to believe small caps are likely to outperform going forward.

Taxation

The mixed fortunes of tax reform in Australia, part 2

Since Federation, reforms to our tax system have proven difficult. Yet they're too important to leave in the too-hard basket, and here's a look at the key ingredients that make a tax reform exercise work, or not.

Investment strategies

8 ways that AI will impact how we invest

AI is affecting ever expanding fields of human activity, and the way we invest is no exception. Here's how investors, advisors and investment managers can better prepare to manage the opportunities and risks that come with AI.

Sponsors

Alliances

© 2024 Morningstar, Inc. All rights reserved.

Disclaimer
The data, research and opinions provided here are for information purposes; are not an offer to buy or sell a security; and are not warranted to be correct, complete or accurate. Morningstar, its affiliates, and third-party content providers are not responsible for any investment decisions, damages or losses resulting from, or related to, the data and analyses or their use. To the extent any content is general advice, it has been prepared for clients of Morningstar Australasia Pty Ltd (ABN: 95 090 665 544, AFSL: 240892), without reference to your financial objectives, situation or needs. For more information refer to our Financial Services Guide. You should consider the advice in light of these matters and if applicable, the relevant Product Disclosure Statement before making any decision to invest. Past performance does not necessarily indicate a financial product’s future performance. To obtain advice tailored to your situation, contact a professional financial adviser. Articles are current as at date of publication.
This website contains information and opinions provided by third parties. Inclusion of this information does not necessarily represent Morningstar’s positions, strategies or opinions and should not be considered an endorsement by Morningstar.