Register For Our Mailing List

Register to receive our free weekly newsletter including editorials.

Home / 428

House prices surge but falls are common and coming

Residential house prices have surged well above pre-covid levels, despite lockdowns, high levels of underemployment, a dramatic reduction in migrant arrivals and jobs uncertainty.

Plenty of short periods of falling house prices

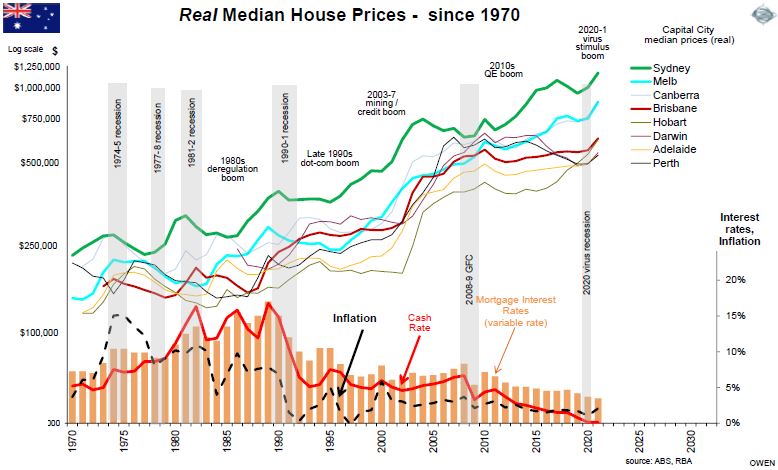
The general impression is that house prices always rise. In fact, prices slowed or contracted during the 2001-5 property finance collapses, the 2008-9 GFC and the 2010-11 sovereign debt crisis. More recently, prices were also brought down by government-imposed lending curbs, first in 2014-15 and then in 2017-18. New Zealand and several other countries have introduced lending restrictions in recent months to slow runaway house prices fuelled by debt at ultra-low interest rates. In Australia, the regulator APRA is likely to do more soon and has already announced an increase in the lending rate 'buffer' to 3%.

The chart below shows 50 years of real (inflation adjusted) house prices in Australian capital cities, and there are plenty of periods of falling prices. Another may be coming soon.

The next chart shows the Sydney housing market pulse in more detail. The blue line tracks the number of house sales per quarter, swinging widely between 16,000+ house sales per quarter in the booms, and then halving in the slowdowns. The green and red bars in the lower section show the annual rate of growth in median prices. It is currently running at 24% growth.

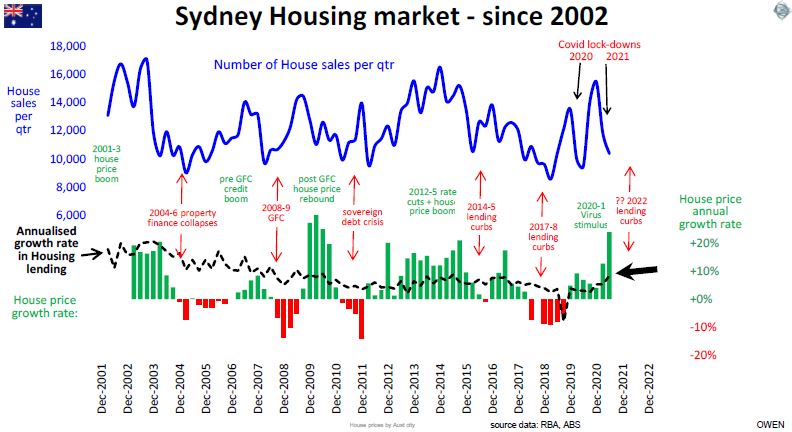
The black dotted line in the lower section of the last chart is the annual rate of growth in housing lending. To the right we see that in 2021, lending growth shot up again to levels that are above the those right before the 2014-5 lending curbs, and above the level right before the 2017-8 curbs.

Direct lending curbs are dressed up in a fancy name these days (‘macroprudential policy’) but they are nothing more than old-fashioned pre-deregulation lending controls in the 1950s to 1970s. Direct lending controls are better than general interest rate rises because they affect the volume of money for the lenders, not the price of money for everyone else, including business borrowers, who should be borrowing more, not less.

House prices rising but why?

House prices are rising because buyers are paying more for them, of course. But where does the extra money come from?

In 1900, the median house price in Sydney was £890 (A$1,780), and the Australian capital city median house was £730 (A$1,460). In the most recent figures (ABS June 2021) the Sydney median was $1,187,500 and the capital city median was $888,000. Over 120 years, that represents average price growth of 6.1% p.a. for both Sydney and the capital city median.

The extra money buyers pay today has come either from their own pockets (higher incomes), or from other peoples’ pockets (debt). If we strip out inflation from each of these, we can separate the sources of house price growth into three components:

(i) real wages growth above inflation

(ii) real growth in the level of debt above inflation, and

(iii) inflation.

The next chart breaks out the overall growth in median capital city house prices into these three components by decade since 1900. The three bars in the middle show the summary periods. Column ‘B’ shows the overall average contributions since 1900; column ‘A’ is for the period 1900 to 1980, and column ‘C’ (and the pie chart) is for the period since 1980.

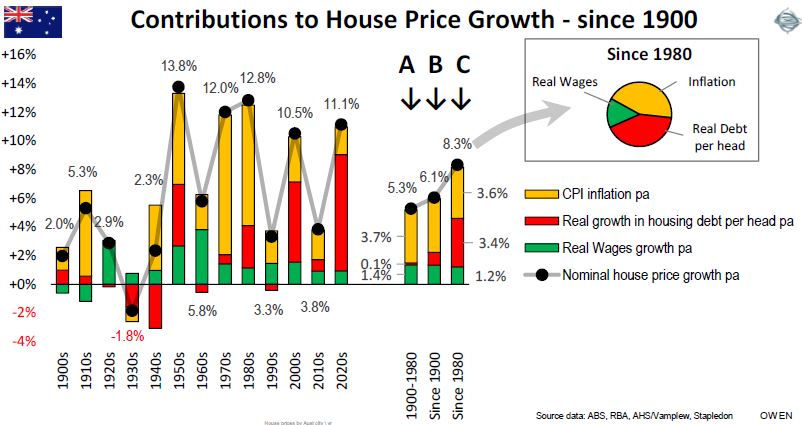
More than half of the overall growth in house prices has been due to inflation with CPI inflation averaging around 3.6% pa from 1900 up to now.

Recent price rises, funded by debt, outstrip inflation 

By itself, declining real wage growth should reduce the rate of real house price growth (because people have relatively less money to spend) but this has been more than offset by a dramatic rise in housing debt. The red bars in columns A (pre-1980) and C (post-1980) show that real (ie after inflation) level of housing debt per head of population did not increase at all from 1900 to 1980 but, since then, it has grown by 3.4% pa above inflation.

Since 1980, three quarters of the growth in real house prices has come from increases in debts and only one quarter of the growth has been due to higher incomes.

Will house prices continue to rise?

Looking at the outlook for each of these three components of house price growth:

(i) For inflation - we estimate around 2-3% pa in the coming years, which is lower than the 3-4% average since 1900.

(ii) For real wages growth – we are unlikely to see a reversal of the post-1980 trend of lower real wages growth. Although we are starting to see signs of a return to protection and onshoring of some jobs in some industries, it is unlikely to reverse the effects of technology, automation, casualisation and ‘uberisation’ of work.

(iii) For debt – house prices can only keep on rising at the same rate if buyers keep increasing their level of housing debt. We consider this next.

House price growth driven mainly by increase in debt

The next chart shows the growth in Australian capital city median house prices since 1900 (maroon line), and the three main components of price growth – real wages (green line), real debt per head of population (red line), and inflation (grey bars).

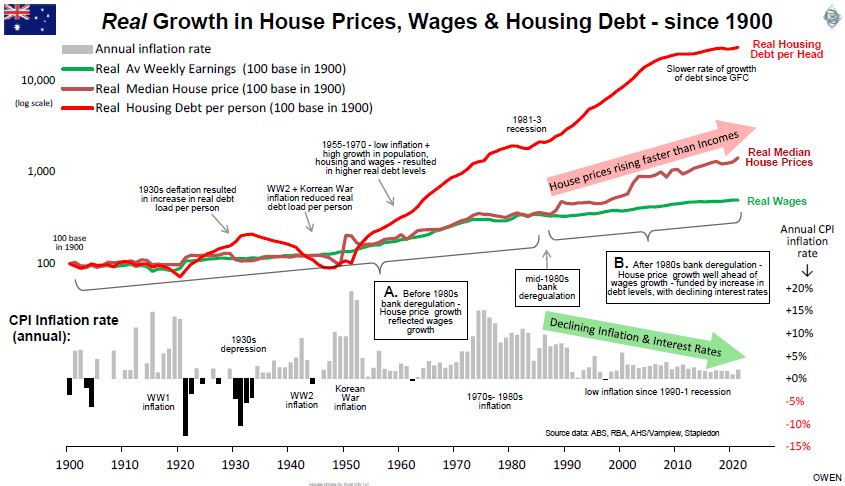
Until the 1980s (box ‘A’), house prices (maroon line) followed wages (green line) in almost in lockstep, which is logical because people can spend more money on housing only if they have more money to spend.

However, from the 1980s onward (box ‘B’), house prices and wages started to diverge onto different paths. What happened in the 1980s?

First, real wages growth (green line) slowed, as a result of the factors listed above. Despite the RBA pining over illusory wages growth, the trend will not reverse.

Second, the key turning point in the 1980s was bank deregulation, in particular the removal of government controls on interest rates, lending volumes, and the entry of foreign and non-banks. The ready availability of credit from many sources has increased substantially. 

Third, inflation and interest rates fell (grey bars), allowing much larger loans per dollar of repayment. For example, in the late 1980s, I had a $240,000, 25 year ‘principal and interest’ mortgage. In 1989 the rate was hiked up to 18% (inflation was 8%). This increased repayments to $3,640 per month, which was more than half of my net income. This year, my daughter bought her first house, borrowing $475,000 from ANZ at 2.0% ‘interest-only’ with repayments of $791 per month, which is a small fraction of her net income. At the same age as I was, she borrowed twice the amount of my loan, but her repayments are one fifth of mine.

This huge expansion of debt (red) at lower interest rates, pushed up house prices (maroon) at a greater rate than wages growth. The chart only shows official housing debt, but there is now a sizeable amount of ‘Bank of Mum and Dad’ debt on top. Every dollar of family money pushes up prices by another dollar, creating an upward spiral fuelled by ‘FOMO’.

Interest rates cannot go lower

The 30-year boom in house prices rising well ahead of income growth is nearing an end. House prices can continue to keep on rising at rates above incomes only if interest rates continue to decline further. Interest rates have not only ended their 30-year decline, they are now more likely to rise than fall from here. The only question is when - and it will be soon.

(We have not discussed some other elements in housing – population, immigration, home ownership and supply constraints – the list goes on. Australia’s heavy reliance on immigration took a hit in the lockdowns but is likely to remain favourable for housing in the medium term, especially from China, Hong Kong and Taiwan).


Ashley Owen is Chief Investment Officer at advisory firm Stanford Brown and The Lunar Group. He is also a Director of Third Link Investment Managers, a fund that supports Australian charities. This article is for general information purposes only and does not consider the circumstances of any individual.


51 Comments
Amanda
July 08, 2023

Do you have any data on property yield since the 1970s? It would be interesting to see how this compares to the median house prices.

Mortgage Broker Australia
April 20, 2022

I love reading this post. Looking forward to more ideas.

Barry
February 05, 2022

Greed. Plain and simple greed, that's all it is and ever will be. The great Australian dream of owning the whole street. Judging by the comments this article was only read by right wingers. Selling your children's future is what you are all doing - how many of you are leaving an inheritance? I thought so...

Marcel
January 18, 2022

The government should do something about the Housing situation is getting crazy and its not just housing its everything is getting expensive. They pumped to much money into the economy, and gave free money to people and companies that didn't need it and now we are paying the price for the governments stupidity. They dont even see there is a problem with inflation there still on the Covid merry-go-round. 

Helen
October 15, 2021

What about the impact of foreign investment? I am not sure what the rules for foreign buyers are and if these have changed? Could this keep house prices high, even if local debt levels don't?

John
October 10, 2021

Most don't remember 1985 when rates went to thru the roof. If this is capable of happening once it can do it again.
In the memorable quote of those days.."It's time"

SMSF Trustee
October 10, 2021

John, your timing is suspect. "It's Time" was in 1972, not 1985. And the argument that rates will go back to 17% just because they got there once is nonsense. That was the only time in centuries that rates were that high - very much an outlier event. Central Banks won't let inflation get out of control to require such high rates again.

albernon
May 07, 2022

Then can you explain why inflation is now out of control globally? Answer: Central Banks have lost control

D
November 21, 2021

The debt to GDP in 1985 was 10.4 percent. It's now four times higher. If rates go up, the system collapses.

Dan
October 10, 2021

I think growth will be going to Tier 2 cities and Regional Towns moving forward. Melbourne and Sydney will be somewhat stagnant.
Your tier 2 cities such as Brisbane, Adelaide and Perth will become more appealing.
Your tier 3 towns such as Townsville, Mackay, Cairns and more will become more attractive as people realise they don't have to live to pay down debt.
The tier 2 and 3 regions are perfectly acceptable and you can lead a great quality of life.
Cheers

Billy
October 09, 2021

All I wanna do is go for property.

That’s all I wanna do is go for property.

That’s it just go for property.

Tones
October 10, 2021

Go for it. people have been predicting price falls, "collapses" for 20 plus years. in the meanwhile, the property has gone up by 200%. big gains to be had. RBA can't raise rates, no one can. will go up 20% this year again.

John
August 14, 2022

Well this comment aged well lol. 

Axel
September 12, 2022

I in fact have lived through a COLLAPSE of 35-40% ! It has never recovered.... Talk to the folks in Japan, Tokyo;)

Joe
October 10, 2021

APRA has the potential to push property price up by 30% when they remove 3% buffer for serveacability. But they will only drip feed if needed in next 10+ years.

Heather
October 10, 2021

Welcome to the tribe billy. find a group of weekend auction warriors to join so you can prep up.

Ted J
October 10, 2021

billy, I also had a business and it was hard work, with 8 employees thousands of rules to follow, pay this and pay that and I got heartily sick of it all, and then I sold up and put everything in the property market. it's a no-risk no-lose option. it always goes up because both federal and state governments protect it.

why go through the hard yards to run a business with the risk and complications, now I just sit back and enjoy and relax and watch my investment go up and up and up. Kachin$, Kachin$ !!

suggest you try your luck asap.

good luck.

Lisa
October 10, 2021

A $240,000 home in the 80’s would certainly not be the equivalent of a $475,000 one today. You were buying a very expensive house at the time so compare something similar. Secondly, repayments on a $475,000 mortgage are NOT $791 a month. Thirdly, why talk about your repayment at 18% when that was a very brief period in the length of your mortgage and then compare it to today’s idiotic rate that will only go up from here?
The banks should have been pulled up two decades ago. We allowed the banks to push us into ridiculous levels of debt just so we could say our houses are worth more. Crazy!

Santos L Halper
October 23, 2021

Maybe try to read the article before letting your misguided outrage hurry you to the comment section.
$475,000 @ 2% I/O is exactly $791 per month. If you can't do that math, the property market isn't for you.

Lisa
November 09, 2021

That’s right, Santos. It would be $791 on an interest only loan. If you took out a principle and interest loan like homeowners usually do it would be a lot more. Sorry I didn’t make that clear.

ashley owen
April 12, 2022

lisa
I write about fact, not fiction (for fiction, I read company annual reports!). I did have an 18% mortgage in the late 1980s (I have published copy of actual statements in previous stories to show how rates went up from 14% to 18%). And my daughter does actually have a $475k mortgage at 2% costing $791 per month today. Facts.

cheers
ashley

Tony
October 09, 2021

At last some sensible analysis, thank you. A huge standout, which you did not mention when comparing your situation to that of your daughter, is that inflation reduced the impact of your (and my) mortgage, as large pay rises caused by inflation, meant the impact of our mortgage reduced rapidly.
This generation will not enjoy this benefit, nor will negative gearers.
Your analysis leads me to believe that we are in for a significant correction, or even crash, in property prices as soon as interest rates rise. People with mortgages borrowed like drunken sailors, both first timers and “investors”, in the belief that property has never fallen in value. They overlook the fact that the current mix of events (zero interest rates, massive mortgages, zero pay rises), never happened before. The confluence of these three events means we are heading for the rocks when it comes to property values.
The fallout will not pretty and everyone, the RBA, APRA, the Federal Government, the Opposition, will always be pointing fingers at each other for the blame.

Bill Jauncey
October 16, 2021

I think you are right Tony - except ..... the electorate will vote for politicians who continue to run policies to boost house prices. Just witness the last Federal election. Now both major parties have policies to boost house prices such as negative gearing on existing properties and 50% CGT deductions. So any significant correction would likely see any Federal government introduce measures to keep the Ponzi scheme going.

Andrew
October 09, 2021

I haven’t lived in Sydney since 2002 and any friend/colleague that tells me they’re moving there from QLD, I ask “are you sick of being happy?”

In 2002, we spent so much time in our car that our “lifestyle” was severely impacted. Seems these days, you cannot travel far without paying tolls in Sydney and the traffic is even worse. So I imagine the car dynamics haven’t changed. Just more tunnels and tolls to enjoy.

What is the main attraction of living in cities with such a high cost of living (particularly property) and being constantly on the mouse wheel?

If the lifestyle is so great, why does everyone come up to Noosa or Byron or Port Douglas or Burleigh (if they can afford it) at the first opportunity for a break?

If you are in Sydney or Melbourne, are you staying there just for job reasons or family reasons or both? With agile working a concrete part of the future, are elderly family connections the only thing keeping you in these places?

I’m interested. Thanks for the charts, Ashley.

Renovation spend would be interesting over the last 20 years. The Block has a lot to answer for.

Bruce Dimond
October 09, 2021

This analysis seems to ignore the fact that most households post 1980 have been double income. Therefore the increase in real wage growth must be much higher than pre 1980 and earlier when most households were single income.

Jason
October 09, 2021

Until they get divorced

Ian Lanser
October 07, 2021

I've followed the housing market for many yeas and made some good moves and some bad ones. This latest boom has me perplexed in where has the pent up demand come from. Yes I understand about people wanting to relocate in these pandemic times, and the convenience of woking from home. But people selling that and upgrading would create a vacancy for first home buyers. Other FHB are building in the outer suburbs and loving it. Have all FHB been living at home with mum and dad and they nor their parents can stand it in this pandemic times.

Phil 666
October 07, 2021

Interest rates will go up interest rates will go down this is part of life. At 12% rates every one said they could not go higher they went to 18% and we survived. At 2% rates everyone said they can not go lower they went to 0.5% Those who expect it to stay low are fooling themselves and rising rates will be sooner than later and we will survive this. Prepare yourselves get a second job have two TV`s instead of three. Stop wanting everything now and more of it , pay your debt down or at least have a buffer for protection. House prices will never stop climbing and real wage growth will always be chasing house prices it is simply put supply and demand in a growing country.
From experience I see nothing but a great future in Australia that will come from hard work

Youi
October 08, 2021

You are right and wrong yes hard work gets you assets and yes rates will go up. However if and when house prices fall it will be a disaster for our economy. Because we are a nation that relies on people getting into more and more debt.

Stuart
October 07, 2021

Interesting and informative article. The standout graph is the “Real housing debt per person”. We all have to live somewhere and that choice is not made by financial analysts, it's made by emotional family decisions. If people are able to borrow more, they will do so to achieve the great Australian dream of owning your own freestanding house and prices will continue to rise. The difference these days is that you no longer expect to pay it off - in the future interest only loans for home occupiers may well become the norm. In that case I would expect the aforementioned graph to only increase and housing prices to go with it.

Ruth
October 07, 2021

I expect the prices of real assets like land and gold to move up in response to the huge international currency creation. We are in a global market so overseas buyers will buy here for cash. I don't want to see too many restrictions on Australians as they can't compete with that. I have been reading that a lot of buyers are from Singapore.
The decade looks to me more like the 1940s than the 1970s. I don't think interest rates can rise much or the AUD will be too strong and we need the export market. I think the rise will continue for some time but as usual it will get overbought and there will be a correction.
NZ is not comparable to Aus to me as I have been reading for a few years that ultra-high net worth people are buying citizenship there ($10 million) and high end properties which they plan to move to should armageddon come e.g. a hot war or financial collapse under the debt loads countries now face.

Jason
October 07, 2021

My understanding is that future house price growth rate generally reflects the average variable interest rate going forward over a long 10 plus year time horizon. For instance, in 2007 the variable rate was 10% and therefore the forward expected house price growth rate was around 10 percent. HOWEVER as interest rates decrease the house price growth rate is turbocharged above 10 percent forecast. The analogy compares to bonds. We have gone through the biggest bond bull market of all time due to falling interest rates.

This means that if you buy the average place right now with high valuation then don't expect more than 3 percent future capital appreciation (0.5-1 percent above inflation). The same goes that if rates rise for whatever reason then that capital growth going forward will be supressed.

Yield is important, and rents tend to rise. Yield is pretty important in this low yield world

Also, if you are persistent buyer then you might nab something for below market value. Seasoned and well capitalised investors are the ones best at this as they have no emotional attachment and can put low ball offers in around the place until they get a strike. Not so easy to do this if you are an inexperienced first home buyer. You can also be lucky, getting into an area that happens to become up and coming.


Rossco
October 07, 2021

Well, I thought it was a good article that covered a lot of ground and your responses to comments were concise and level-headed.
I don't really have much to add other than I wish I'd have worked out that the damn property bubble wasn't/isn't going to burst: I moved back in with my folks over 5 years ago to save up a deposit and have been stuck there since. The longer I saved the more buying power/options on where to buy I had and the more articles I saw that said the property market was an obvious bubble that was obviously due to burst sooner than later. By last year I had a fair wad of money and it seemed like every financial expert was warning of excess household debt, and foreclosures and house prices dropping being sure things but obviously that didn't happen. I read another article today that said if you'd bought in Sydney or Melbourne at the start of the pandemic you'd have made an easy 20% on your money: I had over $150k in the bank and made nothing ??

Matt
October 09, 2021

Yeah sympathetic. Bloody disappointing

John Kavanagh
October 06, 2021

"Direct lending controls are better than general interest rate rises because they affect the volume of money for the lenders, not the price of money for everyone else, including business borrowers, who should be borrowing more, not less." This is not how things turned out. The ACCC, Productivty Commission and RBA have all reviewed the impact of APRA's previous macro interventions and they agree that lenders controlled the volume of lending by putting up rates for new and existing borrowers.

ashley owen
October 06, 2021

hi john,
yes, lower volume and higher rates are the intended aims of the curbs. Plus the nasty big-4 used the curbs to increase their share of lending at the expense of competition. But the point is that the lending controls on housing did not increase interest rates for business lending, which is the real engine of employment and growth. In fact, rationing of lending on housing with the curbs may have shifted the balance of lending volume back toward business lending a little. (I am being optimistic here - bankers much prefer lending to housing - it requires less capital and no brains! Lending to business actually requires some skill)
cheers
ashley

Pat
October 06, 2021

Interest rates are low so therefore they have to go up have you ever heard of Japan they have had ultra low interest rates for the last 20 years and counting. So funny how you always get financial advisors saying property is a horrible investment, I use to be a financial advisor trust me they have no more knowledge about investing than the average person.

ashley
October 06, 2021

I rarely write about housing because i get to argue with 26 million experts!
Australia is no Japan. Japan has the oldest population in the world. Its population has been declining for years and it is terminal, as there is no immigration - it has always been a very closed society structure. As a result, house prices in Tokyo and other cities are still well below their 1989 peak (same as Japanese share prices and commercial property prices).
Australia is the opposite of Japan. Australia (along with NZ, US and Canada) has the most favourable demographics in the world. Australia has had the highest population growth rate in the world over the last century (outside of Africa), largely based on immigration, and this will return after the covid lockdowns end. Australian governments have always been pro-growth and pro-immigration, and this is unlikely to change soon. So, housing in Australia in the big cities has been been a tremendous investment for me personally and for millions of others. Plus it has been supported by a host of tax breaks that are unlikely to be clawed back - although states are now gradually shifting to broad based land/wealth tax for owner-occupiers. But well located housing in the big cities should always be a great investment if bought for the right price at the right time (eg not bought in boom-time FOMO bidding frenzies, and with sensible gearing).
cheers

ashley

Jason
October 07, 2021

I actually think the talk of no immigration during COVID is overblown. I think there has actually been a very high growth in buyers over the last 18 months. For instance the department of immigration hit its PR target this year and last year by simply turning many of the temporary residents currently here on the waiting list into permanent residents who are then able to buy. Then you have had all the returning expats from NYC etc (I think about 350,000 since March last year) with massive bank accounts just buying a house because they can easily do it.

The falls in migration have been in temporary migrants (before covid it was about 10 percent of australia's population and could be 50 percent as there is no cap) who have no right to buying property as well as students who have the right to buy property but normally dont have the means to do so.

This suggests that there might be a recovery in rents in the cities when temporary migrants arrive and squeeze into the high rise dog boxes that are empty. Of course rising rents also push up prices but also leads to more cranes, more dog boxes etc. Probably the value is in housing as they are becoming scarcer and scarcer in the big cities as many are knocked down to build units

Max Williams
October 06, 2021

One factor that needs to be included is the increase in median household income. While wages growth has been sluggish the number of folks in the household earning has increased considerably as a percentage. In most homes couples are both working.

Craig Jones
October 06, 2021

Great analysis. Rising female work participation rates since pre 80s
is also a factor which won’t be repeated.

Peter Sheahan
October 06, 2021

That is a point rarely made Craig and intergenerational wealth distribution is another key factor.
My father was the last of 10 kids and my mother 2nd last of 6. I have only 3 children. Is the average no. of children in families these days higher or lower than 2?

Peter Symonds
October 06, 2021

We should copy what New Zealand is doing to slow this insane real estate market including raising interest rates to non emergency levels.

Howard Coleman
October 06, 2021

The median home today also has more bedrooms and especially more bathrooms than in previous decades. Compared to 1900 there has also been the addition of garages for cars. To be more meaningful, the square meterage of the home sizes should also be compared. I'd expect that if we saw a graph of real (after accounting for inflation) cost of housing per square metre, we'd see little increase since 1900. Homes have simply got bigger.

ashley
October 06, 2021

hi howard
yes the the median today is certainly nothing like the median decades ago or a hundred years ago (no electricity, lean-to kitchen out the back, outside dunny etc). I do track the average dwelling size over time - basically the average number of people per household has more than halved, while the average size per dwelling has more than doubled. The land component is what provides the capital growth, but improvements are essentially lifestyle expenses that depreciate in value and after a while a worth nothing and need replacing. The 'median' values paid for housing include the land component plus the perceived present value of the money spent on improvements, R&M, capex, etc. So, ultimately, the overall cost of housing (land plus improvements expense) should more or less be a function of peoples' incomes over time.
cheers
ashley

Harry
October 06, 2021

Thanks for that. Interesting analysis and some very interesting points.

I think to say however, in passing at the end that we haven't considered immigration is perhaps trivialising a major factor accounting for availability of cash, especially when say in China, there are more multimillioaires than the entire Australian population. That can surely distort markets.

Secondly, in Sydney there is geographical constraint from mountains and national parks, putting inceasing pressure on land price the further that population grows.

Thirdly and importantly, looking at Sydney as an example, It is very flawed to look at changes in house prices by looking at average house prices in Sydney now, to say 80 years ago and saying "oh, its 6.1% pa" . The average house 80 years ago might have been in Mosman, and now the average house might be in Burwood . Not the same house.

ashley owen
October 06, 2021

hi harry
yes I agree - see my response to Howard above. The 6% pa growth is not a 'return' in the normal sense because much or most of it reflects the increased cost of the improvements, which are a lifestyle expense, not an 'asset' that grows. (the improvements depreciate in value - even the tax office gives you a refund because the value depreciates and eventually is worth nothing!). Hence the importance of staying close to the city where the land value is the greatest portion of the price paid. The good news for the growth cities (Sydney, Melb and maybe Brisbane) is that the immigration flocks there, increasing the population, so what is now considered 'boondocks' (cheaper outer suburbs) will one day be 'middle ring'. Mosman and Burwood were once outer grazing lands, now they are inner or middle ring.
This endless population growth story for Sydney and Melbourne is most unusual. Australia, Norway and Canada have very rare city structures - with vast emptiness between a small number of cities with diversified industries driven by almost continuous high levels of immigration. Very different to the US, UK and Europe, which are essentially a relatively tight patchwork of close towns and small cities, many of which rely on one industry and suffer when the industry dies or leaves town.
cheers
ashley

Andrew Smith
October 06, 2021

Disagree on 'This endless population growth story for Sydney and Melbourne is most unusual.' as there is no evidence that it will be continuous, recent news was that Syd/Mel combined have lost 245k in population (unsure source)? Backgrounded by the coming 'big die off' in the permanent population which is ageing and generations after Baby Boomers or at least Gen X, are below replacement fertility of 2.1%.

Also, does 6% p.a. (ex. inflation) compare with investing into a share portfolio with lower holding costs and compounding income with capital gains....?

The attractiveness of Syd/Mel may have more to do with old colonial state structures with capital cities and implicit power central, and better to view Australian states as like the EU states?

Further, Australia uses the NOM net overseas migration formula (UNPD) which sweeps up temporary churn over e.g. international students, NZ'ers etc. residing 12/16+ months; in future dependent upon the same student sources e.g. China which is unlikely (numbers were dropping well before Covid).

The NOM was expanded in 2006 inflating headline numbers or creating 'froth', neither announced nor noticed by anyone, hence, cannot be compared globally as few if any other nations use the same NOM formula ex. Anglosphere or UK and NZ? (many simply estimate from visas and residency records), and e.g. EU Schengen Zone lacks formal borders to measure arrivals/departures.

Geoff Weaver
October 06, 2021

Log scales on the graphs are misleading.

Tommy
October 09, 2021

Property always goes up! Don’t worry ask your mother.

Get in quick lest you miss out. Lest you miss out

Data viz 101
October 20, 2021

Log scales are always used over long periods of time like this, where the value range is large . The trends would look even more blown out if it were not using log.


Leave a Comment:

RELATED ARTICLES

Noel's share winners and loser plus budget reality check

Where to from here for house prices?

Australia’s residential property boom

banner

Most viewed in recent weeks

2024/25 super thresholds – key changes and implications

The ATO has released all the superannuation rates and thresholds that will apply from 1 July 2024. Here's what’s changing and what’s not, and some key considerations and opportunities in the lead up to 30 June and beyond.

The greatest investor you’ve never heard of

Jim Simons has achieved breathtaking returns of 62% p.a. over 33 years, a track record like no other, yet he remains little known to the public. Here’s how he’s done it, and the lessons that can be applied to our own investing.

Five months on from cancer diagnosis

Life has radically shifted with my brain cancer, and I don’t know if it will ever be the same again. After decades of writing and a dozen years with Firstlinks, I still want to contribute, but exactly how and when I do that is unclear.

Is Australia ready for its population growth over the next decade?

Australia will have 3.7 million more people in a decade's time, though the growth won't be evenly distributed. Over 85s will see the fastest growth, while the number of younger people will barely rise. 

Welcome to Firstlinks Edition 552 with weekend update

Being rich is having a high-paying job and accumulating fancy houses and cars, while being wealthy is owning assets that provide passive income, as well as freedom and flexibility. Knowing the difference can reframe your life.

  • 21 March 2024

Why LICs may be close to bottoming

Investor disgust, consolidation, de-listings, price discounts, activist investors entering - it’s what typically happens at business cycle troughs, and it’s happening to LICs now. That may present a potential opportunity.

Latest Updates

Shares

20 US stocks to buy and hold forever

Recently, I compiled a list of ASX stocks that you could buy and hold forever. Here’s a follow-up list of US stocks that you could own indefinitely, including well-known names like Microsoft, as well as lesser-known gems.

The public servants demanding $3m super tax exemption

The $3 million super tax will capture retired, and soon to retire, public servants and politicians who are members of defined benefit superannuation schemes. Lobbying efforts for exemptions to the tax are intensifying.

Property

Baby Boomer housing needs

Baby boomers will account for a third of population growth between 2024 and 2029, making this generation the biggest age-related growth sector over this period. They will shape the housing market with their unique preferences.

SMSF strategies

Meg on SMSFs: When the first member of a couple dies

The surviving spouse has a lot to think about when a member of an SMSF dies. While it pays to understand the options quickly, often they’re best served by moving a little more slowly before making final decisions.

Shares

Small caps are compelling but not for the reasons you might think...

Your author prematurely advocated investing in small caps almost 12 months ago. Since then, the investment landscape has changed, and there are even more reasons to believe small caps are likely to outperform going forward.

Taxation

The mixed fortunes of tax reform in Australia, part 2

Since Federation, reforms to our tax system have proven difficult. Yet they're too important to leave in the too-hard basket, and here's a look at the key ingredients that make a tax reform exercise work, or not.

Investment strategies

8 ways that AI will impact how we invest

AI is affecting ever expanding fields of human activity, and the way we invest is no exception. Here's how investors, advisors and investment managers can better prepare to manage the opportunities and risks that come with AI.

Sponsors

Alliances

© 2024 Morningstar, Inc. All rights reserved.

Disclaimer
The data, research and opinions provided here are for information purposes; are not an offer to buy or sell a security; and are not warranted to be correct, complete or accurate. Morningstar, its affiliates, and third-party content providers are not responsible for any investment decisions, damages or losses resulting from, or related to, the data and analyses or their use. To the extent any content is general advice, it has been prepared for clients of Morningstar Australasia Pty Ltd (ABN: 95 090 665 544, AFSL: 240892), without reference to your financial objectives, situation or needs. For more information refer to our Financial Services Guide. You should consider the advice in light of these matters and if applicable, the relevant Product Disclosure Statement before making any decision to invest. Past performance does not necessarily indicate a financial product’s future performance. To obtain advice tailored to your situation, contact a professional financial adviser. Articles are current as at date of publication.
This website contains information and opinions provided by third parties. Inclusion of this information does not necessarily represent Morningstar’s positions, strategies or opinions and should not be considered an endorsement by Morningstar.