Register For Our Mailing List

Register to receive our free weekly newsletter including editorials.

Home / 639

I called inflation's rise and fall and here's what's next

From 1st December it [the US Federal Reserve] is to stop quantitative tightening, i.e., the policy of actively reducing the size of its securities holdings and balance sheet. The present phase of QT [quantitative tightening] began in spring 2022 – and more forcefully in autumn 2022 – as part of the Fed’s then campaign to curb the USA’s inflationary pressures. This QT approach contrasted with the quantitative easing it pursued in the two years from early 2020 and, in an earlier cyclical episode, from 2009 to 2014.

Quantitative easing had – in that earlier episode – been intended to support economic activity, and to obviate the adverse impacts on output and employment of the Great Recession. In my latest book Money and Inflation at the Time of Covid I argue that the QE exercise in the early 2020s was responsible for an explosion in money growth and was the main causal driver of the subsequent increase in inflation. On the other hand, QT from early 2022 reduced the quantity of money. In fact, the US quantity of money (on the broadly defined M3 measure) fell for much of 2022, while in the two years to March 2024 it was roughly unchanged. According to the analytical framework (of “broad-money monetarism”) developed in Money and Inflation at the Time of Covid, as well as a large body of earlier work from me, the change from rapid money growth in 2020 and 2021 to money stagnation in the two years from spring 2022 ought logically to have been associated with a marked deceleration in inflation. Indeed, I said as much in my regular Institute of International Monetary Research commentary in May 2022. This duly happened, with inflation at the end of the Biden Presidency coming back towards the Fed’s 2% target.

The chart below shows the story in the 2020s of the effects of its open market operations on the Federal Reserve’s holdings of securities. The surge in those holdings in April 2020 – of almost $1,350b. in the four weeks to 15th April, from $4,007.5b. to $5,357.0b. – is evident. It was the dominant reason that broad money surged at that time. In fact, in the one month of April 2020 M3 broad money jumped by 7.4%, more than in any full year in the 2010s. (I use the M3 number estimated by the Shadow Government Statistics consultancy, to whom my thanks.)

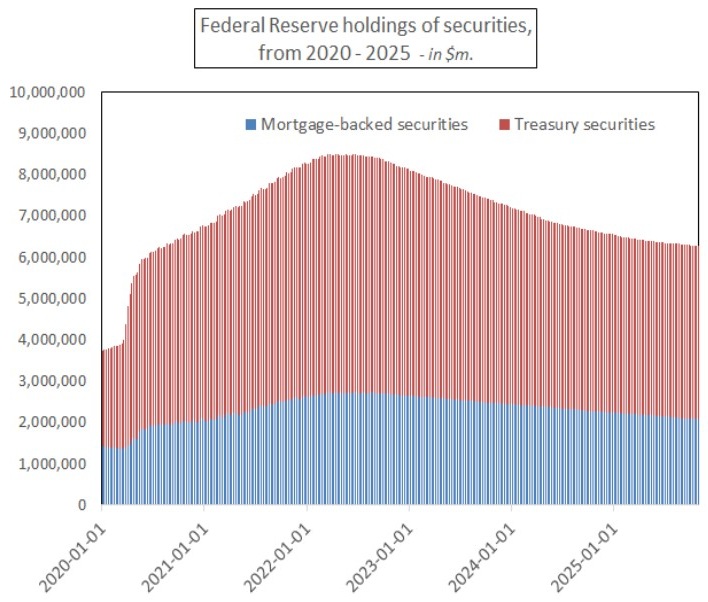
The purchases of securities were smaller in the following months, but QE continued to spring 2022, when on 13th April the Fed’s holding of securities peaked at a remarkable $8,502.2b. But the chart also brings out that spring 2022 was the watershed between excessive money growth and a marked monetary constriction. Between 13th April 2022 and 15th May 2024 the Fed’s holdings of securities dropped from $8,502.2b. to $6,860.1b. Its holdings of Treasury securities plunged between the two dates from $5,762.1b. to $4,488.1b., as the US national debt was increasingly held outside the banking system in the hands of long-term investors. The shrinkage of the Fed’s Treasury bond total coincided with a rise in the US budget deficit, because of President Biden’s so-called “expansionary fiscal policy”. Needless to say, bond yields rose as long-term investors had to absorb both the new debt from the deficit and debt being jettisoned by the Fed.

Managers of the US public debt are finding it harder to market their wares as the years of deficit continue. In recent commentary I pointed out that total assets held by money market mutual funds on 15th October 2025 were $7,367.3b., 14.9% higher than on 16th October 2024, with the difference between the two dates being $899.5b. After a regulatory clampdown following the Great Financial Crisis, MMMFs [money market mutual funds] are allowed to hold only kind of new asset, claims on the US Treasury with less than a year to maturity. (By holding such claims – which are taken to be very safe – the MMMFs can always repay depositors at 100 cents in the $. The worry had been that in the GFC they came close to “breaking the buck.”)

But it is obvious that the MMMFs – with their almost $900b. balance-sheet expansion in the year to mid-October – are now crucial to the financing of the US Federal deficit of about twice the size. It has to be emphasized that MMMF funding is very short-term in character, while the liabilities of MMMFs are quasi-monetary. The debt isn’t being financed from the central bank and in that sense American policymakers are not “resorting to the printing presses”. But – in my view – selling paper of less than one year to the MMMFs is monetary financing of the deficit. (Readers might wonder what has happened since 15th October. The answer is that MMMF assets on 29th October were $7,418.3b. The annualised growth rate in the fortnight was 19.6%. The message of the analysis is unchanged.)

Assume the US Federal deficit is $2,000b. in the 2025/26 fiscal year (i.e., that running from October 2025 to September 2026). If $1,500b. of that is financed from the commercial banks and MMMFs, I would suggest that the positive effect on broad money (now about $30,000b. on the M3 measure) would be roughly 5%. If banks are also growing their loan books, broad money growth will be more than 5%.

The importance of the Fed’s latest announcement becomes clear. Without QT acting to reduce the quantity of money and hence the rate of money growth, the expectation has to be that the annual rate of money growth will be in the high single digits, i.e., with a typical rate of increase of 6% - 8%. This is too high to be consistent with 2% inflation. Instead, while monetary policy settings stay as they now are, annual inflation is more likely to be in a 2% - 5% band. The Fed will fail to bring inflation back to the kind of figures deemed normal for most of the last 30 or so years. The basic underlying problem is that the large budget deficit is in conflict with anti-inflationary monetary policy.

My claim here may challenge the consensus view. Well, so what? My correct forecasts of almost double-digit US inflation in early 2020 were an application of (what I regard as) an organized and successful theory of the determination of nominal national income and inflation. My current prognosis is just another application of that theory.


Professor Tim Congdon, CBE, is Chairman of the Institute of International Monetary Research at the University of Buckingham, England. Professor Congdon is often regarded as the UK’s leading exponent of the quantity theory of money (or ‘monetarism’). He served as an adviser to the Conservative Government between 1992 and 1997 as a member of the Treasury Panel of Independent Forecasters. He has also authored many books and academic articles on monetarism.

This article is general information and does not consider the circumstances of any investor.


  •   26 November 2025
  • 3
  •      
  •   
3 Comments
Warren Bird
December 01, 2025

You did, Prof Congdon, and I've since kept track of broad money growth and inflation in Australia. Following money supply enabled me to see by mid-2024 that the inflation outbreak of 2020 had been brought under control as a cash rate increase to 4.35% did its job. I was happy to see some easing in 2025.
However, similarly to Prof Congdon's observations for the US, we've seen money growth accelerate in Australia. Pretty much since the first rate cut in Feb 2025 credit creation took off and broad money growth doubled quite quickly from around 4-5% pa to its current rate of 9%. The RBA should have cautioned in February that it wasn't starting a 'cycle of easing' and that borrowers shouldn't presume a continued lowering of rates. They didn't - they didn't caution about it and then they actually cut too quickly and a bit too far.
It's no wonder we've got inflation back above 3%.
If we want inflation consistently below 3% pa (and I believe we should want that), then it would be a lot easier if money wasn't growing at 9% pa. Sadly, this definitely puts rate increases back on the list of possibilities.
That said, the new monthly CPI includes a seasonally adjusted series (about which I've seen virtually no comments from any of the media outlets) that shows that the annual increase of 3.8% largely happened in our winter months, and in spring the annualised rate of CPI increase was 2.7%. Inflation isn't totally out of control yet and hopefully, with no more prospect of further rate cuts, both credit creation and price increases can settle again.
But that's more of a hope than a forecast. Monetary policy faces a very challenging few months.

Dudley
December 02, 2025


"Sadly, this definitely puts rate increases back on the list of possibilities.":

Sad part of interest rate increases is that part due to inflation; taxes of which are a nice earner for government.

1
 

Leave a Comment:

RELATED ARTICLES

Can quantitative tightening help the Fed fight inflation?

Globalisation is morphing into something less promising

Three reasons high inflation may trigger a European crisis

banner

Most viewed in recent weeks

Indexation implications – key changes to 2026/27 super thresholds

Stay on top of the latest changes to superannuation rates and thresholds for 2026, including increases to transfer balance cap, concessional contributions cap, and non-concessional contributions cap.

The refinery problem: A different kind of energy crisis in 2026

The Strait of Hormuz closure due to US-Iran conflict severely disrupted global energy supply chains. While various emergency measures mitigated the crude impact, the refined product market faces unprecedented stress.

The missing 30%: how LIC returns are understated, and why it matters

The perceived underperformance of LICs compared to ETFs is due to existing comparison data excluding crucial information, highlighting the need for proper assessment and transparent reporting.

Little‑known government scheme can help retirees tap into $3 trillion of housing wealth

The Home Equity Access Scheme in Australia allows older homeowners to tap into their home equity for retirement income, yet remains underused due to lack of awareness and its perceived complexity.

Origins of the mislabeled capital gains tax ‘discount’

Debate over the CGT discount is intensifying amid concerns about intergenerational equity and housing affordability. This analysis shows that the 'discount' does not necessarily favor property investors.

Div 296 may mean your estate pays tax on assets your beneficiaries never receive

The new super tax, applying from 1 July, introduces more than just a higher rate on large balances. It brings into focus a misalignment between where wealth sits and where the tax on that wealth ultimately falls.

Latest Updates

The ultimate superannuation EOFY checklist 2026

Here is a checklist of 28 important issues you should address before June 30 to ensure your SMSF or other super fund is in order and that you are making the most of the strategies available.

Retirement

Two months into retirement

A retirement researcher's take on retirement and her focus on each of her six resource buckets to stay engaged during the transition and beyond.

Superannuation

Markets have always delivered for super fund members. What if they don’t?

What happens if market resilience in the face of ongoing geopolitical tensions ends? Potential decade-long market weakness shows the need for contingency planning.

Retirement

We tend to spend less in retirement …

Studies show that a drop in expenditure during retirement leads to a happier retirement. But when costs ramp up again later in life, it's a guaranteed income that makes spending more hurt less.

Shares

Can you value a share just using dividends?

A cow for her milk, a stock for her dividends. Investors are too quick to dismiss this valuation technique. 

Property

The 25-year property trust default is being questioned

The 33% CGT discount rate being floated isn’t random. It sits at the structural break-even between trust and company for the multi-property cohort. That’s driving the conversation we’re hearing now.

Investment strategies

Are active managers bringing a knife to a gunfight?

How passive investing has permanently changed market structure — and why sophisticated tools are now the price of survival.

Sponsors

Alliances

© 2026 Morningstar, Inc. All rights reserved.

Disclaimer
The data, research and opinions provided here are for information purposes; are not an offer to buy or sell a security; and are not warranted to be correct, complete or accurate. Morningstar, its affiliates, and third-party content providers are not responsible for any investment decisions, damages or losses resulting from, or related to, the data and analyses or their use. To the extent any content is general advice, it has been prepared for clients of Morningstar Australasia Pty Ltd (ABN: 95 090 665 544, AFSL: 240892), without reference to your financial objectives, situation or needs. For more information refer to our Financial Services Guide. You should consider the advice in light of these matters and if applicable, the relevant Product Disclosure Statement before making any decision to invest. Past performance does not necessarily indicate a financial product’s future performance. To obtain advice tailored to your situation, contact a professional financial adviser. Articles are current as at date of publication.
This website contains information and opinions provided by third parties. Inclusion of this information does not necessarily represent Morningstar’s positions, strategies or opinions and should not be considered an endorsement by Morningstar.