There is a widely held belief, supported by theory, that rising bond yields should be bad for share prices. But is this true in real life? Just about every stockbroker and security analyst in the world today uses valuation models driven by discount rates based on long term government bond yields. The implication is that, all else being equal, a rise in government bond yields (which drives discount rates) should result in a fall in asset values.
The problem of course is that all else is never equal. Rising bond yields are usually the result of rising expectations of future interest rates and/or rising expectations of future inflation. The factors that drive these expectations are often also driving expectations of increased economic activity which, to varying degrees, may be expected to flow through to higher company revenues, profits and dividends. As a result, the relationship between government bond yields and share prices is more complex than it first seems.
This article studies all 27 bond yield spikes in the US market since World War II and their impacts on share prices. A subsequent paper will look at the Australian market.
Figure 1: US 10 year Treasuries and S&P500 share price index since 1980
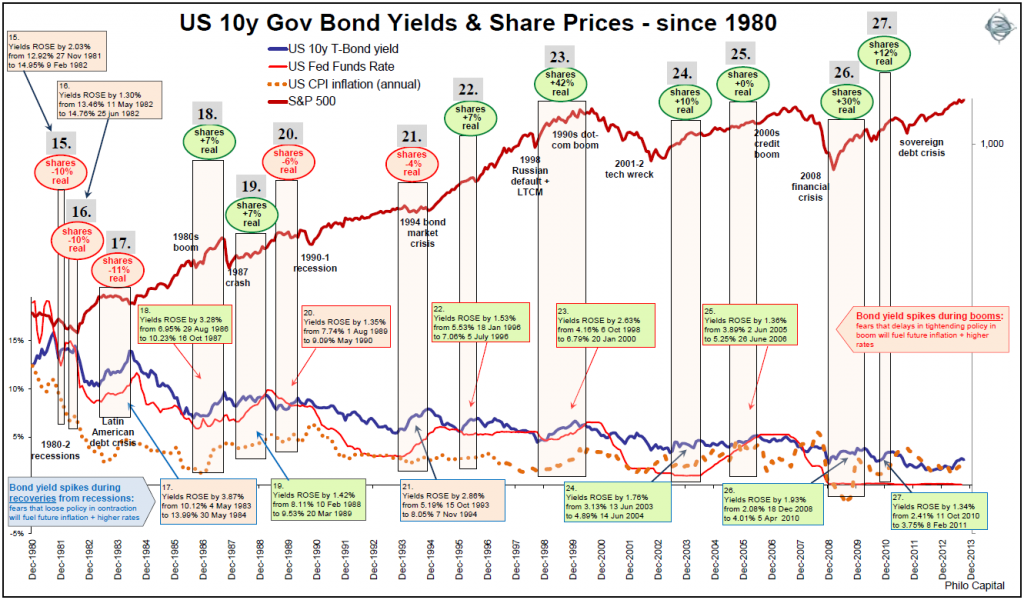
(Click on the figure to enlarge it and see the detail better).
Statistical relationship bonds and shares
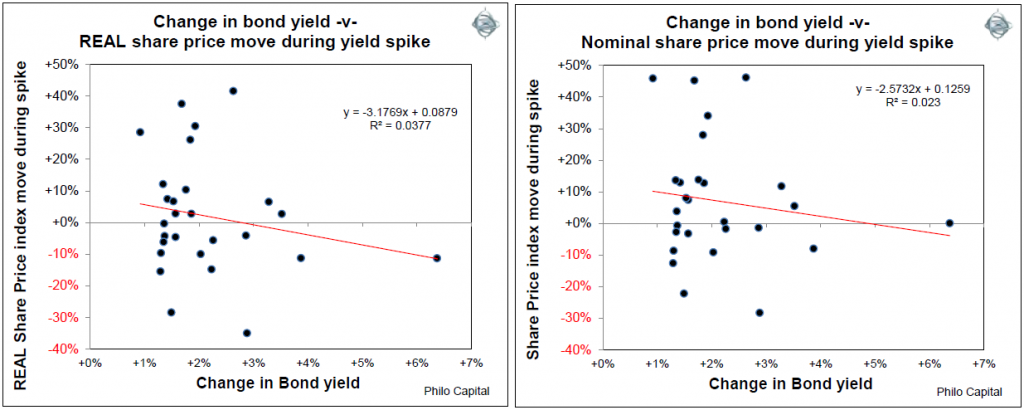
Bond yield spikes on the whole have had no consistent impact on, or statistical relationship with, share prices in the US market, either in the rising inflation phase (1946-1981) or in the disinflation phase (post-1981). It is notable that:
- Around half of the US bond yield spikes since 1946 were accompanied by rising nominal share prices during the yield spike. (57% during the 1946-1981 rising inflation phase, 62% during the post 1981 disinflation phase, and 59% overall)
- Around half of the bond yield spikes since 1946 were accompanied by rising real share prices during the yield spike. (43% during the 1946-1981 rising inflation phase, 54% during the post 1981 disinflation phase, and 48% overall).
This is shown in the following pair of charts that plot changes in bond yields during bond yield spikes versus nominal share price moves during the yield spike (left chart), and versus real share price moves during the yield spike (right chart). They show no clear relationship between the magnitude of the yield spike and share price returns during the spike:
Level of nominal bond yields at start of rate rise
What does make a difference to share price returns during bond yield spikes is the level of nominal bond yields at the start of the yield spike:
- all of the bond yield spikes that started when nominal bond yields were low were accompanied by high nominal and real returns from shares during the spike; and
- all of the bond yield spikes that started when nominal bond yields were high were accompanied by low nominal and real returns from shares during the spike.
This pattern has been consistent in both the rising inflation phase and also in the disinflation phase.
The next pair of charts shows this moderately strong negative relationship between the nominal bond yield at the start of the yield spike versus nominal share price moves during the yield spike (left chart), and versus real share price moves during the yield spike (right chart):
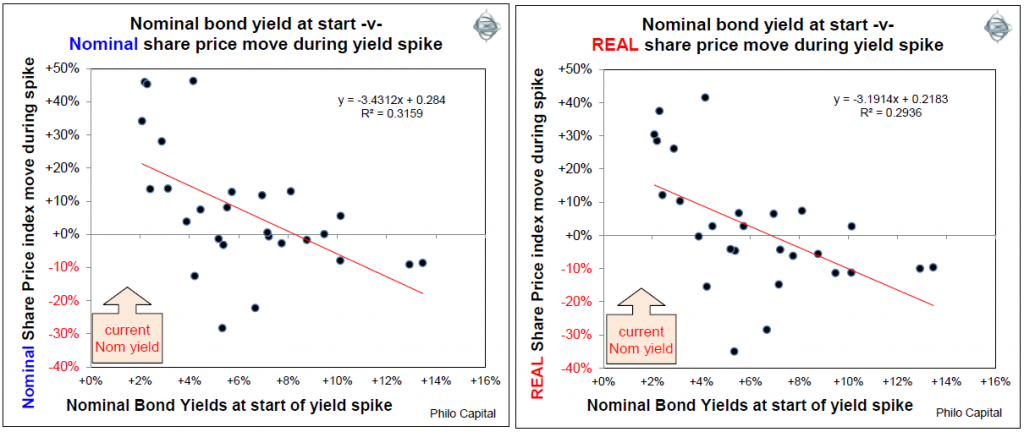
Current yield spike: When the last bond yield spike started in July 2012, the nominal bond yield at the start was an extremely low 1.43%. In all prior yield spikes since 1946 that started with nominal yields at very low levels, share prices have risen strongly in both nominal and real terms during the bond yield spike. This is the case once again during the current yield spike, as we are still bullish on US equities. (Editor’s note: this paper was written in March 2015).
Potential for favourable share returns
There are some reasonable indications that share returns are likely to be favourable during the current bond yield spike. Specifically:
- Rising bond yields that start when nominal bond yields are low (which was the case at the start of the last bond yield spike and also the case now) have consistently been accompanied by high nominal and real returns from shares during past bond yield spikes. This has been the case through all types of market conditions and inflationary environments during the post-World War II era.
- Rising bond yields that start when the CPI inflation rate is low (which was the case at the start of the last bond yield spike, and is still true now) have consistently been accompanied by high nominal and real returns from shares during past bond yield spikes. This has also been the case through all types of market conditions and inflationary environments during the post-World War II era.
At least we can say that historical precedents provide no warnings of poor returns, as poor returns have occurred when nominal bond yields and/or CPI inflation rates are high during the yield spikes, and neither is the case at present.
We wrote an original paper on this subject warning of the last yield spike in 2012, and the S&P500 index of US stocks indeed rose by 40% between when yields bottomed at the start of that spike to the last day in December 2013 (bond yields rose by 1.61% to 3.04%).
This is consistent with the patterns over the past seven decades through a wide variety of inflationary conditions, and this provides support for our relative bullish stance on US shares over the period, in the face of rising bond yields.
Ashley Owen is Joint CEO of Philo Capital Advisers and a director and adviser to the Third Link Growth Fund. This article is for general educational purposes only. It is not personal financial advice and does not consider the circumstances of any individual.