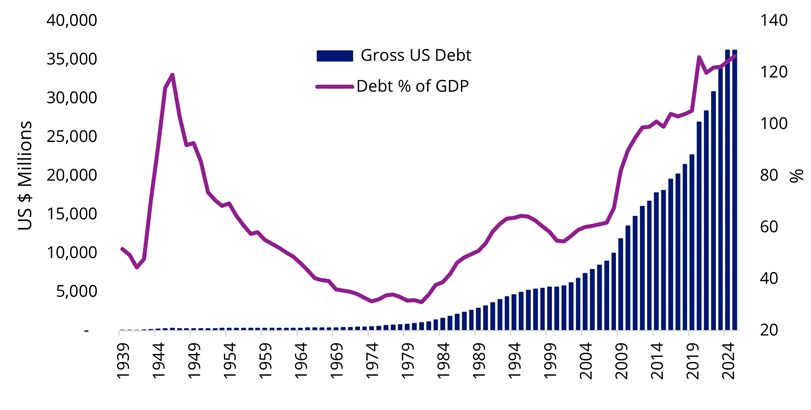
From the eve of World War II (WWII) to Trump 2.0 in 2025, US Federal debt has grown 751-fold to about US$36.2 trillion. It’s an amount difficult to comprehend, and the pace of debt accumulation, at 7.86% per annum, has exceeded nominal GDP growth (~6% per annum) and the capital-gain pace of US equities (~7.3% per annum).
Chart 1: Accumulation of US debt
Source: VanEck. FRED. Bloomberg. Data in USD.
As the US debt ceiling looms again, increasing headlines warn this could end in bond yields exploding and equities markets capitulating. Those worries have not yet been manifested into reality. Why? The simple answer lies in long-standing US exceptionalism and the US dollar’s reserve-currency privilege.
Today, Trump’s ambitious fiscal push, the so-called “One Big Beautiful Bill” (OBBB), along with a generational-scale tariff aggression, is putting the US’s credit status to the test again. To prepare for what could be a bumpy ride, we revisit the historical lessons of US debt shocks over the past century.
A tale told three ways
1) WWII debt spike (1942-1951)
During WWII, surging government spending sent the US debt-to-GDP ratio from 40% to close to 120% over a short time span.
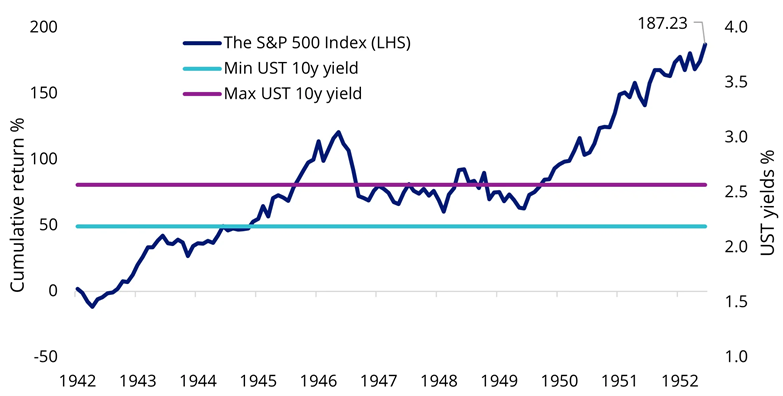
Such escalation of fiscal stress significantly increased borrowing costs and potentially crowded out private investment critical for war production. To manage this risk, the Treasury-Fed pact (1942) introduced a yield-curve-control (YCC) strategy, which capped the T-bill rate at 0.375% and the 10-year Treasury yield at 2% by having the Fed commit to purchasing unlimited excess bonds.
As a result, the Fed ultimately bought over US$20 billion in treasuries, equivalent to 10% of the entire marketable US federal debt at the war’s peak. After 1945, post-war economic growth and rapidly expanding nominal GDP allowed the debt-to-GDP ratio to roll back steadily.
Impact on markets
Driven by YCC, Treasury yields were successfully kept at low levels, avoiding extreme bond market volatility. Initially, in early 1942, equities sold off, and volatility spiked. Nevertheless, as real yields turned negative (inflation higher than bond yields), investors switched to equities for a potential return more than inflation (as opposed to the guaranteed return below inflation of bonds and term deposits at the time).
This sparked a rally in the equity market. By the end of this episode, strong nominal growth, resilient corporate earnings and moderate inflation brewed a robust bull market for equities, with the S&P 500 ending 1952 around 187% higher than levels in 1942.
Chart 2: US equities’ response to YCC & post-war recovery
Source: VanEck, Robert Shiller online data. Bloomberg. Performance in USD.
Takeaways for today
This scenario describes an ideal outcome pursued by Trump’s administration, where the US economy grows out of high debt by keeping real yields negative. However, in the late 1940s and early 50s confidence in “US exceptionalism” was unshaken. The dollar was on the gold standard, the US was on the rise to becoming the world’s biggest superpower, and Victory-Bond drives amplified demand for US Treasuries.
We think this is outcome is unlikely to be repeated today given the current mass of debt, structurally lower nominal GDP growth, and limited Fed capacity (and willingness) to absorb excess Treasury issuance.
2) Reagan-era debt piling, stagflation and Volcker’s shock (1981-1994)
The 1980s to early 90s in the US were defined by tax cuts under Reagan (Trump’s favourite role model), surging defence spending driven by the Cold War, and lingering stagflation pressure from the previous decade.
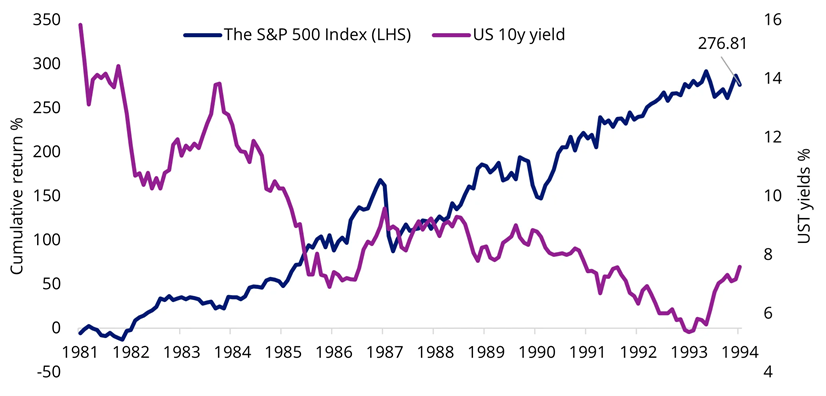
An economy experiencing stagflation has the combination of high inflation, stagnant economic growth, and elevated unemployment. As a result, US borrowing accelerated, leading the debt-to-GDP ratio to rise from 31.2% to 64.4%. In 1981, Cold War-era spending combined with the oil price crisis driven by the Gulf War fuelled inflation, which peaked at 15.7%.
To curb the unsustainable inflation, Fed Chair Paul Volcker hiked interest rates above inflation levels to an unprecedented 20% in 1981. This restored credibility but caused a recession in the short run.
Impact on markets
Bond yields spiked initially due to rising debt levels and intense interest rate hikes by Fed Chair Volcker. They stayed higher until the recession caused them to drop back to around 6-8%. At first, equities also suffered, but quickly entered a decade-long rally. They ended 1994 with a gain of 276.71% compared to the start of 1981, supported by lower real yields, renewed confidence in US dominance, and nominal GDP growth.
Chart 3: Bond yields fall and equities rally in the 1980s
Source: VanEck. Bloomberg. Performance in USD.
Takeaways for today
The stagflation scenario is the most challenging one but is potentially the closest to today’s US economy. During that time, investors’ confidence in “US exceptionalism” was put to the test, and the Fed had limited capacity to manage down bond yields.
In the early 1980s, that faith was shaken, with bond yields skyrocketing to double-digit levels and equities markets suffering. However, Volcker’s “whatever it takes” stance restored confidence. That supported the Fed’s “hold-and-watch” mindset today.
The essence of the story today is that while Trump’s spending agenda could be considered concerning, the US economy's ability to pass the confidence check is potentially more hinged on whether markets still trust the Fed to prevent yields from escaping the corral. For investors, this means staying invested but watching two gauges daily: breakeven inflation and the 10-year yield.
A firm Fed hand keeps both contained; a break in either one could be the potential red flag.
3) GFC debt spike, QE-driven yields and fiscal stimulus (2007-2014)
To save Wall Street from the storm of the Global Financial Crisis (GFC) in 2008, aggressive fiscal stimulus and bank bailouts caused the debt-to-GDP ratio to grow from 64% to over 100%. Additionally, the Fed introduced Quantitative Easing (QE), buying trillions in treasuries and mortgage-backed securities to manage long-term yields, supporting economic recovery.
Impact on markets
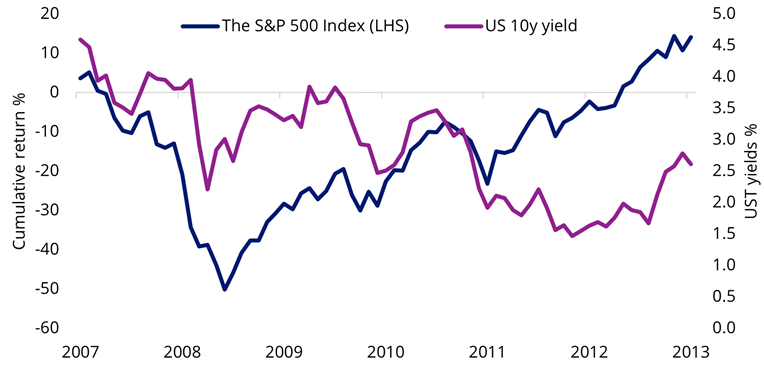
Driven by QE policies, bond yields fell sharply, from around 4.6% to below 2% by the end of 2012. This kept a lid on borrowing costs, while facilitating debt refinancing and encouraging private-sector investment. Low yields acted as an essential stimulus channel, helping the broader economy recover despite elevated public debt levels.
The S&P 500 lost half of its value in one year. However, as the impact of QE started to restore confidence in the US's credibility and growth outlook, it entered a years-long recovery starting in early 2009. By early 2013, US equity markets had returned to their previous highs.
Chart 4: QE policies send bond yields falling, rescuing equities
Source: VanEck. Bloomberg. Performance in USD.
Takeaways for today
Amid a major financial crisis, confidence in “US exceptionalism” is meaningfully dampened, as evidenced by the persistent sell-off of equities. However, while it takes longer to repair, the Fed still seems to have the power to restore trust by keeping long-end yields on a leash.
In today’s environment, the 5-year/5-year forward breakeven rate is lingering around 2.2%, slightly below the critical 2.5% level, which hints that QE would be politically toxic. The 10-year and 30-year auctions remain healthy, and the Fed is slowing its balance-sheet runoff. What this all shows, we think, is that today’s Fed still has room to move, though narrower than pre-GFC times, to keep long-end yields under control.
Stay invested, watch the Fed
There have been doubts about “US Exceptionalism” throughout the past century, after World War II, through Volcker’s stagflation battle, and during the GFC. However, history shows that US financial markets, particularly equities, are resilient. Equities tend to recover from US debt shocks quickly if long-end bond yields remain under control, with the Fed holding the leash.
In today’s world, while the Fed has shown reluctance to ease prematurely given the tariff overhang and geopolitical uncertainty, it still has the tools and capacity to implement another round of yield-curve control (YCC) or quantitative easing (QE). The key question is when it will need to act.
Indeed, smart investors have started to reconsider the right allocation to the US, but that number should not be zero. In fact, it is most likely to be just a touch lower than in the past, just as long as the Fed holds the leash.
Anna Wu is a Senior Associate, Cross-Asset Investment Research at VanEck, a sponsor of Firstlinks.
The VanEck MSCI International Quality ETF (QUAL) tracks the MSCI World ex Australia Quality Index and invests in around 300 of the world’s highest quality companies. A hedged version of QUAL is also available for investors.
This is general information only and does not take into account any person’s financial objectives, situation or needs. Any views expressed are opinions of the author at the time of writing and is not a recommendation to act.
For more articles and papers from VanEck, please click here.