Register For Our Mailing List

Register to receive our free weekly newsletter including editorials.

Home / 229

Stock market winners 10 years on

It has been 10 years since the end of the 2003-2007 global China/credit boom, and it is time to check in on how stock markets have fared since then. The left chart ranks countries by their broad share price index growth over the past decade. Only 36 of the 62 main stock markets are ahead of their pre-GFC highs. The right chart shows average economic growth rates per country over the same period, in the same country order as the market performance, to demonstrate if economic growth relates to share price growth.

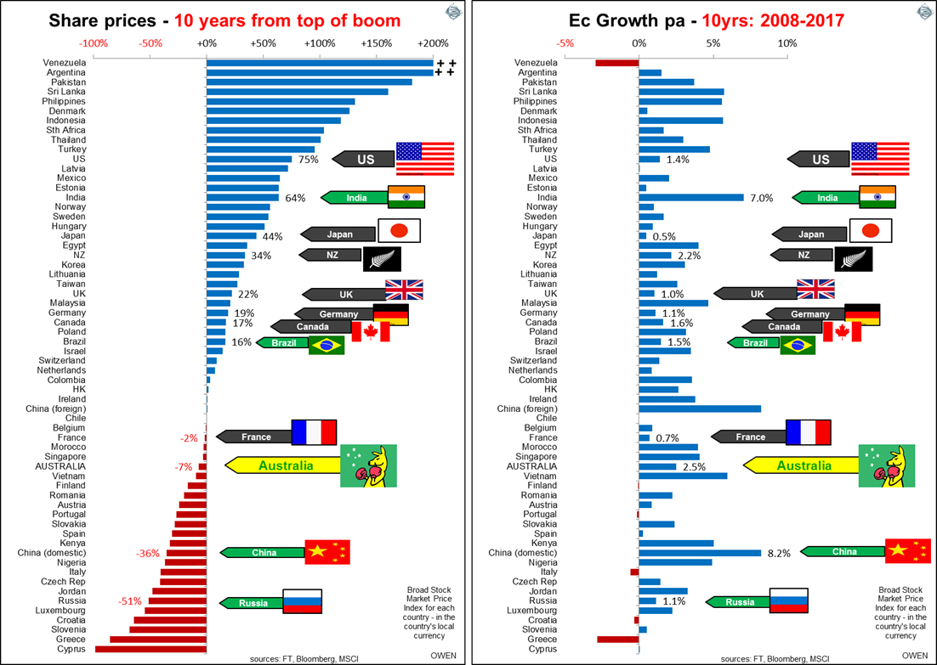
Among the ‘developed’ markets, Denmark won the gold medal in January 2013 for being the first stock market to surpass its pre-GFC peak, and it is now 126% ahead (i.e. more than double its pre-GFC peak). The silver medal went to the US in March 2013 and bronze went to the UK in May 2013. [See previous articles, Stock market Olympics, and the winners are and Australia can learn from gold medal winner, Denmark].

As usual there has been no statistical relationship between economic growth and share prices when measured across countries. Australia has been the so-called ‘miracle economy’ with the strongest long-term economic growth rate in the ‘developed’ world, and it did not even suffer an economic recession in the GFC, thanks to a deficit spending spree our grandchildren will be paying off. Yet the local stock market index (in price terms, not accumulation including dividends) is still behind its November 2007 high.

In contrast, the US, UK, Western Europe, Canada and even New Zealand suffered far lower economic growth rates in the GFC and over the past 10 years, but they have generated much stronger share prices than Australia. Denmark, the stand-out gold medallist stock market in the developed world, has had virtually no economic growth over the past 10 years. At the other end of the scale, China had the fastest economic growth rate over the past decade (and the largest aggregate growth in human history) but has had one of the worst stock markets.

Another common feature is that countries with the strongest stock markets often suffer political, economic or social turmoil and this was the case again - e.g. Argentina, Venezuela, Pakistan, Philippines, Turkey and Mexico.

There are many reasons for differences in share prices in different countries of course, but this quick snapshot is a useful reminder of the folly of focusing on economic growth as a pointer to share prices.


Ashley Owen is Chief Investment Officer at advisory firm Stanford Brown and The Lunar Group. He is also a Director of Third Link Investment Managers, a fund that supports Australian charities. This article is general information that does not consider the circumstances of any individual.


6 Comments
Phil
January 28, 2018

Is 10 years really long enough for it to be statistically sound. The article uses the word statistical basis. It's one period and correlations can change depending on a number of other variables, not just GDP.

Albert
January 28, 2018

True that GDP does not correlated with Stock returns. Markets rise and fall.

Some points to note :
1. Few of us would invest in countries like uninformed, poorly developed, small third world markets - so this is largely irrelevant in our investable universe.

2. We need to have a large investment in our locale of domicile to match risk and liability/needs. Yes, we can hedge currency but there is a cost to wear which comes off your long term return.

3. Given that we invest in largely open and efficient markets the long term returns will equalise i.e. investors will appropriately price high vs low growth stock markets resulting in rational returns for risk. Overseas have done well for now but this will change too.

ashley
November 30, 2017

hi Chris -
regarding inflation - i also measure each market after its domestic inflation.
In addition I also measure each in terms of AUD returns on both a hedged AUD basis and un-hedged AUD. So there are dozens of ways of measuring returns.
For the above story I used the domestic nominal returns in each country in the local currency of each country - in order to show what the stock market for each country did for local investors in that country - because most investors have a heavy 'home bias' and think primarily about their own market in their own currency when then think about shares.
So back to returns after inflation - Australia actually does considerably worse on real returns because our inflation rate is significantly higher than other developed world markets - eg Europe, US, UK and Japan.
Cheers
Ashley

Chris Jankowski
November 30, 2017

It looks to me that the results reported for the two top places - Venezuela and Argentina are completely bogus. Both of these countries had periods of uncontrolled and under reported high inflation. The simplistic comparison most likely ignores that.

By these standards the undisputed leader, had it been reported, would certainly be Zimbabwe.

ashley
November 30, 2017

hi mark

Adding dividends (and even adding franking credits) doesn't get the ASX anywhere near the leaders. ASX total returns including divs only gets us +37% ahead of its 2007 high.
And adding franking credits as well only gets it to +62% above the 2007 high. That is still below the S&P500 PRICE index which is +66% ahead (before dividends), and it is still some 40% below the S&P500 total return index including US dividends.
(and Aust is also still behind other major markets like Japan, UK, Germany and even NZ on a total return basis)

cheers
ashley

Mark Higgins
November 30, 2017

Think you need to factor in our high dividends - eg the all odds Accumulation Index - then we are ahead.


Leave a Comment:

RELATED ARTICLES

GFC and personal reflections, 10 years on

Podcast: What did you do during the GFC? Warning signs and lessons for investors

The ASX's 16-year drought: a rebuttal

banner

Most viewed in recent weeks

Raising the GST to 15%

Treasurer Jim Chalmers aims to tackle tax reform but faces challenges. Previous reviews struggled due to political sensitivities, highlighting the need for comprehensive and politically feasible change.

7 examples of how the new super tax will be calculated

You've no doubt heard about Division 296. These case studies show what people at various levels above the $3 million threshold might need to pay the ATO, with examples ranging from under $500 to more than $35,000.

The revolt against Baby Boomer wealth

The $3m super tax could be put down to the Government needing money and the wealthy being easy targets. It’s deeper than that though and this looks at the factors behind the policy and why more taxes on the wealthy are coming.

Meg on SMSFs: Withdrawing assets ahead of the $3m super tax

The super tax has caused an almighty scuffle, but for SMSFs impacted by the proposed tax, a big question remains: what should they do now? Here are ideas for those wanting to withdraw money from their SMSF.

Are franking credits hurting Australia’s economy?

Business investment and per capita GDP have languished over the past decade and the Labor Government is conducting inquiries to find out why. Franking credits should be part of the debate about our stalling economy.

Here's what should replace the $3 million super tax

With Div. 296 looming, is there a smarter way to tax superannuation? This proposes a fairer, income-linked alternative that respects compounding, ensures predictability, and avoids taxing unrealised capital gains. 

Latest Updates

Investment strategies

9 winning investment strategies

There are many ways to invest in stocks, but some strategies are more effective than others. Here are nine tried and tested investment approaches - choosing one of these can improve your chances of reaching your financial goals.

Planning

Super, death and taxes – time to rethink your estate plans?

The $3 million super tax has many rethinking their super strategies, especially issues of wealth transfer on death. This reviews the taxes on super benefits and offers investment alternatives.

Taxation

Raising the GST to 15%

Treasurer Jim Chalmers aims to tackle tax reform but faces challenges. Previous reviews struggled due to political sensitivities, highlighting the need for comprehensive and politically feasible change.

Shares

The megatrend you simply cannot ignore

Markets are reassessing the impact of AI, with initial euphoria giving way to growing scepticism. This shift is evident in the performance of ASX-listed AI beneficiaries, creating potential opportunities.

Gold

Is this the real reason for gold's surge past $3,000?

Concerns over the US fiscal position seem to have overtaken geopolitics and interest rates as the biggest tailwind for gold prices. Even if a debt crisis doesn't seem likely, there could be more support on the way.

Exchange traded products

Is now the time to invest in small caps?

With further RBA rate cuts forecast this year, small caps may be key beneficiaries. There are quality small cap LICs and LITs trading at discounts to net assets, offering opportunities for astute investors.

Strategy

Welcome to the grey war

Forget speculation about a future US-China conflict - it's already happening. Through cyberwarfare and propaganda, China is waging a grey war designed to weaken democracies without firing a single shot.

Sponsors

Alliances

© 2025 Morningstar, Inc. All rights reserved.

Disclaimer
The data, research and opinions provided here are for information purposes; are not an offer to buy or sell a security; and are not warranted to be correct, complete or accurate. Morningstar, its affiliates, and third-party content providers are not responsible for any investment decisions, damages or losses resulting from, or related to, the data and analyses or their use. To the extent any content is general advice, it has been prepared for clients of Morningstar Australasia Pty Ltd (ABN: 95 090 665 544, AFSL: 240892), without reference to your financial objectives, situation or needs. For more information refer to our Financial Services Guide. You should consider the advice in light of these matters and if applicable, the relevant Product Disclosure Statement before making any decision to invest. Past performance does not necessarily indicate a financial product’s future performance. To obtain advice tailored to your situation, contact a professional financial adviser. Articles are current as at date of publication.
This website contains information and opinions provided by third parties. Inclusion of this information does not necessarily represent Morningstar’s positions, strategies or opinions and should not be considered an endorsement by Morningstar.