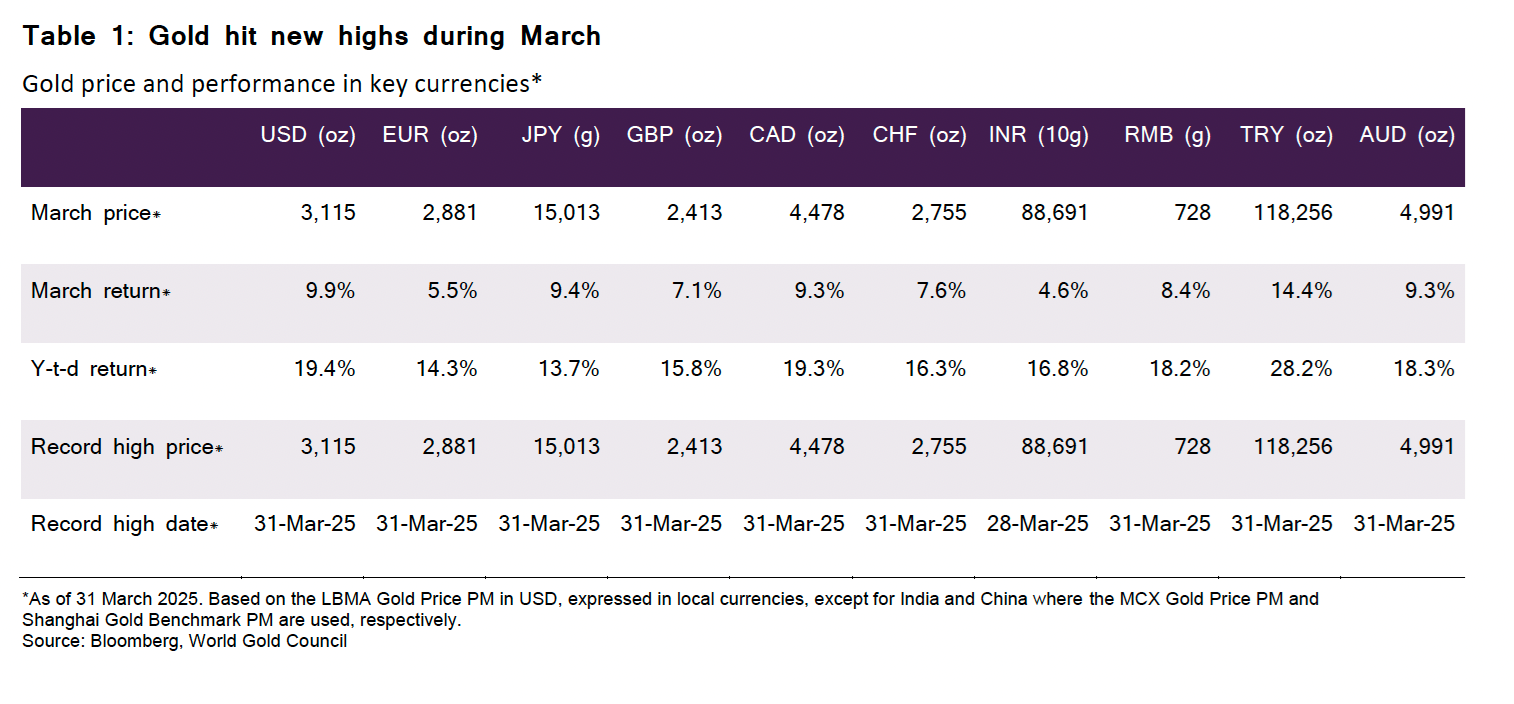
Another month, another set of new highs. Gold finished March at US$3,115/oz, a monthly gain of 9.9% and 9.3% in US and Australian dollar terms, respectively. Gold’s stellar performance across all major currencies is even more remarkable given the significantly weaker US dollar and the strengthening euro, (Table 1).
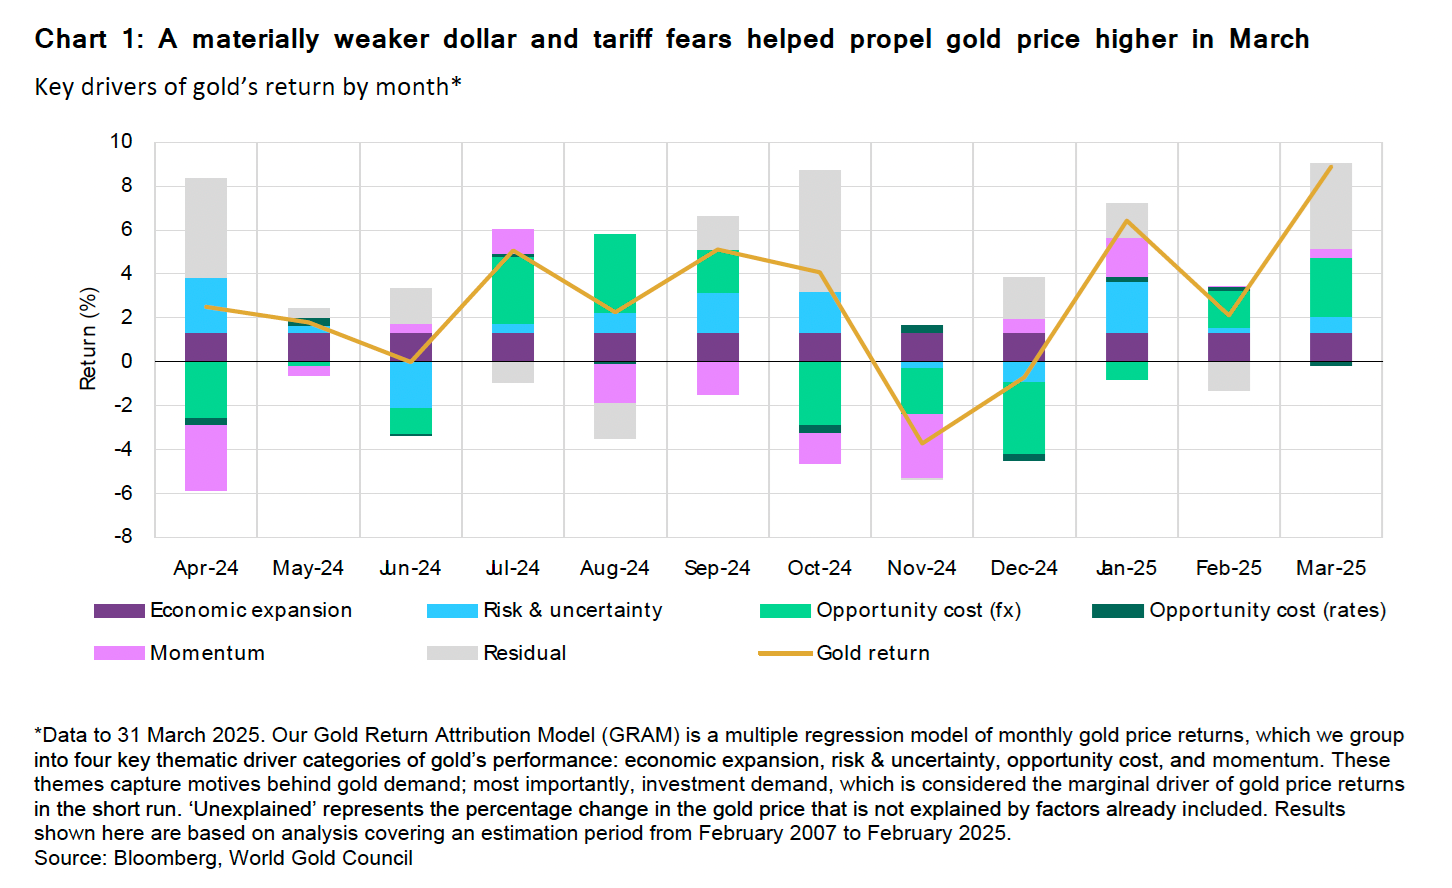
According to our Gold Return Attribution Model (GRAM), euro strength, and thus US dollar weakness, was once again a key driver of gold’s performance, alongside an increase in geopolitical risk capturing tariff fears, (Chart 1).
Gold ETF buying continued apace in March with all regions contributing. US funds led the charge with US$6 billion (67 tons) of net inflows followed by Europe then Asia with approximately US$1 billion each, (Table 2: Country Flows).
Australian ETF funds attracted US$78 million in March, the fourth consecutive net inflow since last November, contributing to a 6.7% rise in demand over Q1 (the strongest quarter since Q3 2020 when holdings went up 17%).
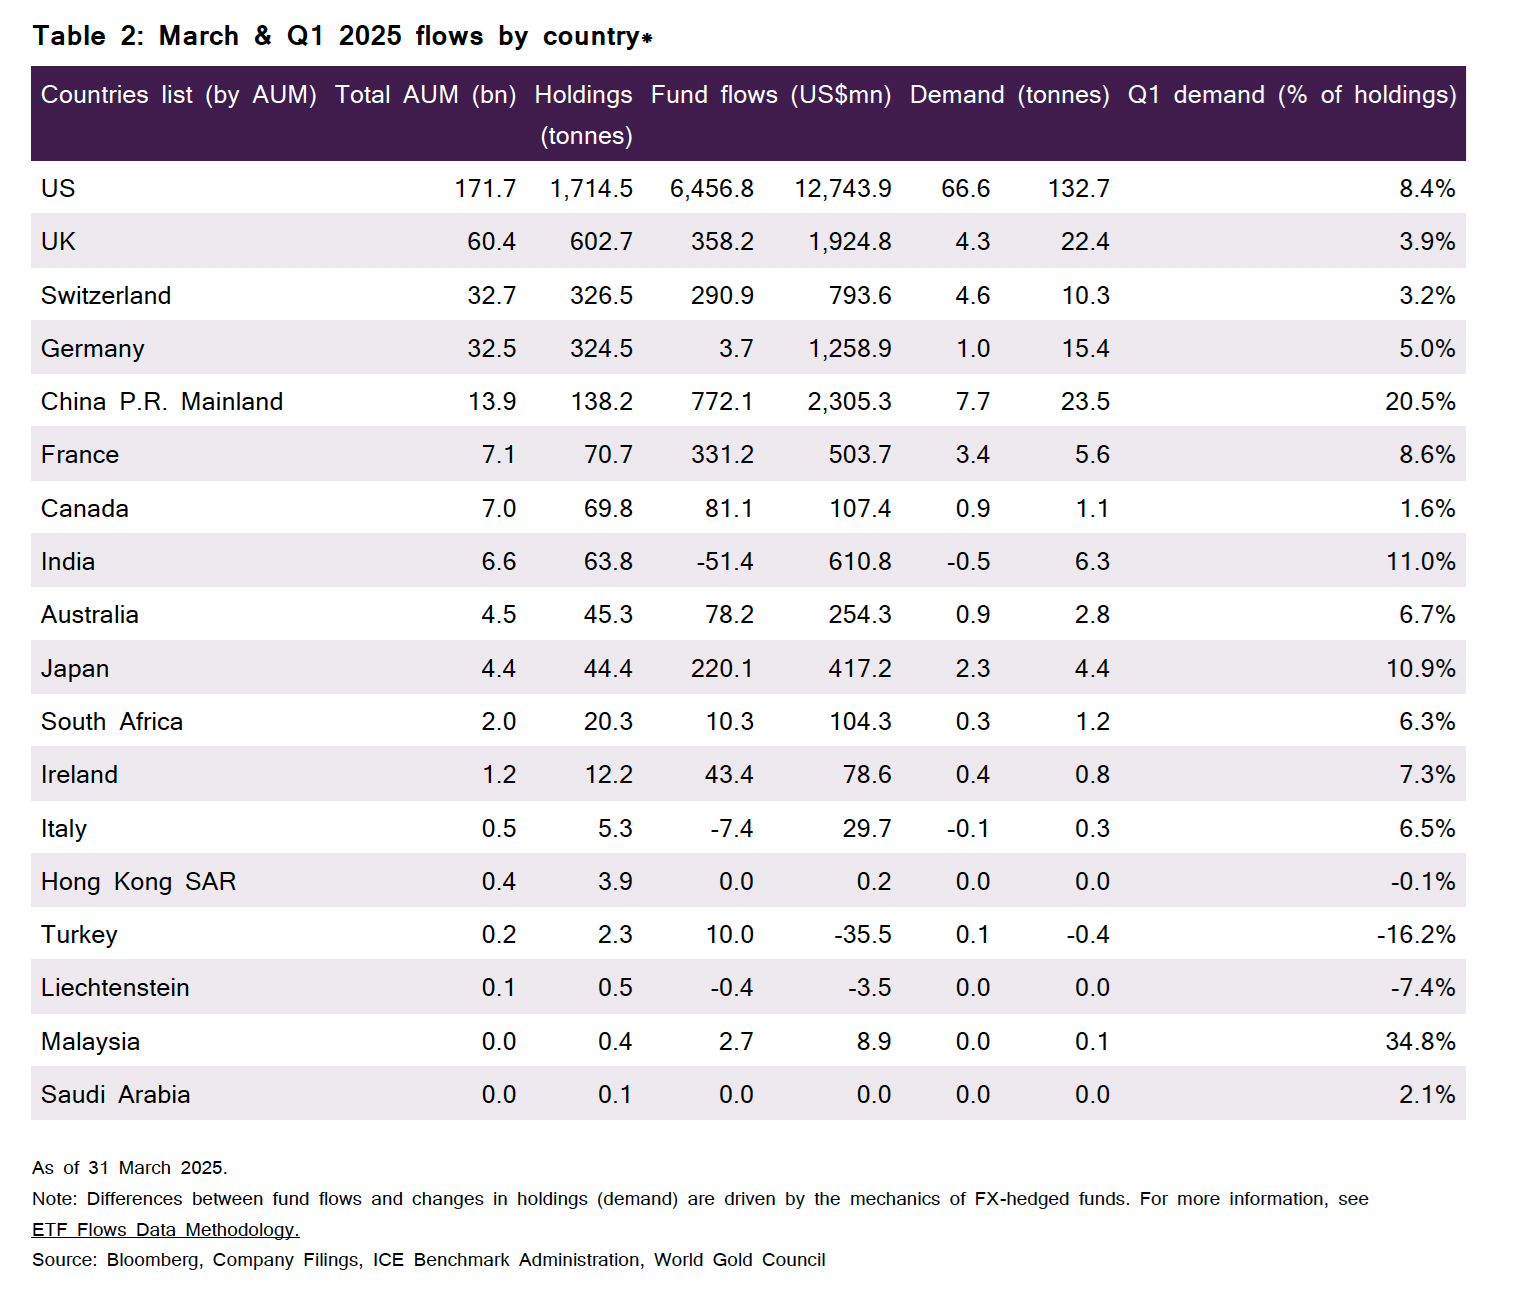
While ETF flows were positive, COMEX futures declined marginally by US$400 million (five tonnes) – likely on profit taking.
Post-COVID markets hooked on artificial support
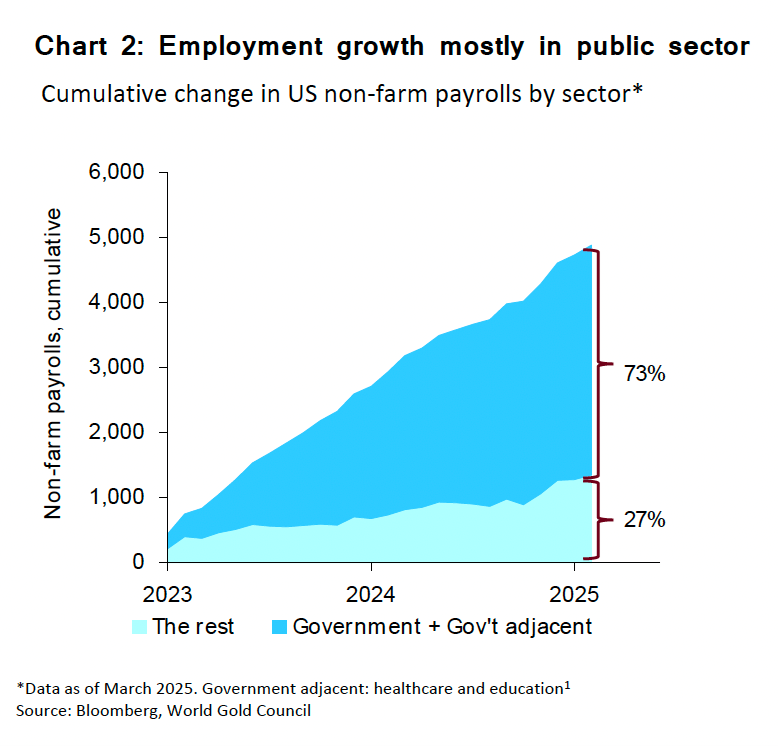
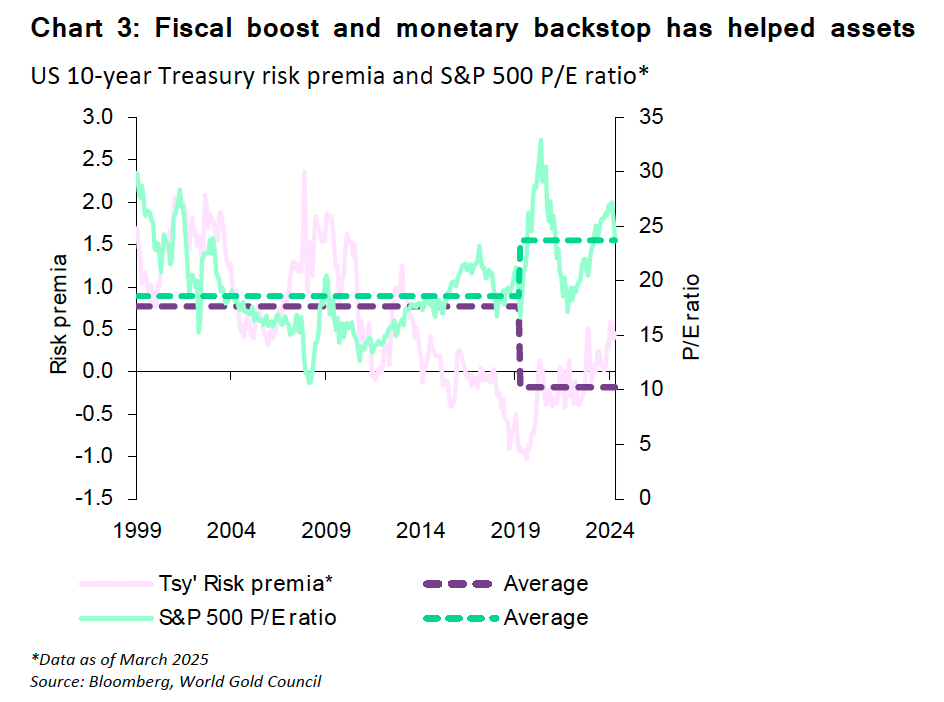
Liquidity has arguably bolstered both financial assets and the US economy for much of the post-COVID period. Fiscal spending programs arguably propped up job creation via government and government-adjacent jobs, (Chart 2). Capital markets were also aided by fiscal liquidity provisions combined with a continuation of the ‘monetary backstop’ from the Fed. This helped compress the Treasury bond risk premium to well below its pre-COVID average, at the same time keeping equity multiples well above their pre-COVID averages, (Chart 3).
But there are several key contrasts between the current scenario and that of 2022, when the Fed’s first rate rise in years signalled the end of a long period of fiscal easing and the start of inflationary pressure across most developed markets.
Back then, US financial conditions tightened forcefully as liquidity was removed from markets as central banks hiked rates to target inflation. This coincided with a perfect storm that saw a very rare joint decline in bonds and equities (a 60/40 blend of S&P 500 stocks and US treasuries dropped, as did economic activity). Gold held up but also experienced some bumps along the way. It initially fell 20% over two quarters in 2022 before making a recovery to end the year flat.
We are now at a similar impasse in liquidity conditions
While much of the conversation in recent weeks has centered on tariffs, liquidity risk remains an important undercurrent.
Quantitative tightening is slowing, but there has been no mention of a resumption of quantitative easing. Indeed, the appetite might not be there, given the high levels of debt and sticky inflation. In addition, constraints on government spending via the Department of Government Efficiency (DOGE) are stifling fiscal support.
And the Fed’s Overnight Reverse Repo facility (ON RRP) is low, which provides less wiggle room for the Fed to manage liquidity issues. This appears to be showing up in stats like order-book liquidity for equity futures as flagged in the Fed’s financial stability report in November 2024 – on-the-run bond liquidity (i.e the ease to trade recently-issued U.S Treasury securities, which is also the most liquid). It may also be contributing to the year-to-date equity rout.
And the labour market is flirting with contraction as hours worked are in steep decline. Logically, this leads to an employment slowdown as companies reduce hours for staff before layoffs; statistically this also appears to be the case. But layoffs are also now rising and are likely to soon be reflected in payroll numbers. To add to this, uncertainty surrounding tariffs has supercharged concerns about the resilience of labour markets in the short and medium term.
Similar but different
Even if we see a similar drying up of liquidity, it’s likely to be different to 2022, because:
- While inflation was rising more in 2022, it was driven by growth. This time around, inflation is sticky while growth is faltering, resulting in a stagflationary environment. In this context, rates are not likely to lift further from here and the US dollar should fall, at least in the short-term, as US exceptionalism wavers.
- Central banks’ bullion buying efforts have been strong contributors to gold’s performance over the past three years and this will likely continue, adding fundamental support to prices.
- US gold ETF investors had built up sizeable holdings in 2020 before the 2022 wobbles. But they have been sidelined until recently, suggesting capacity to keep adding.
Gold’s fundamentals remain in place…
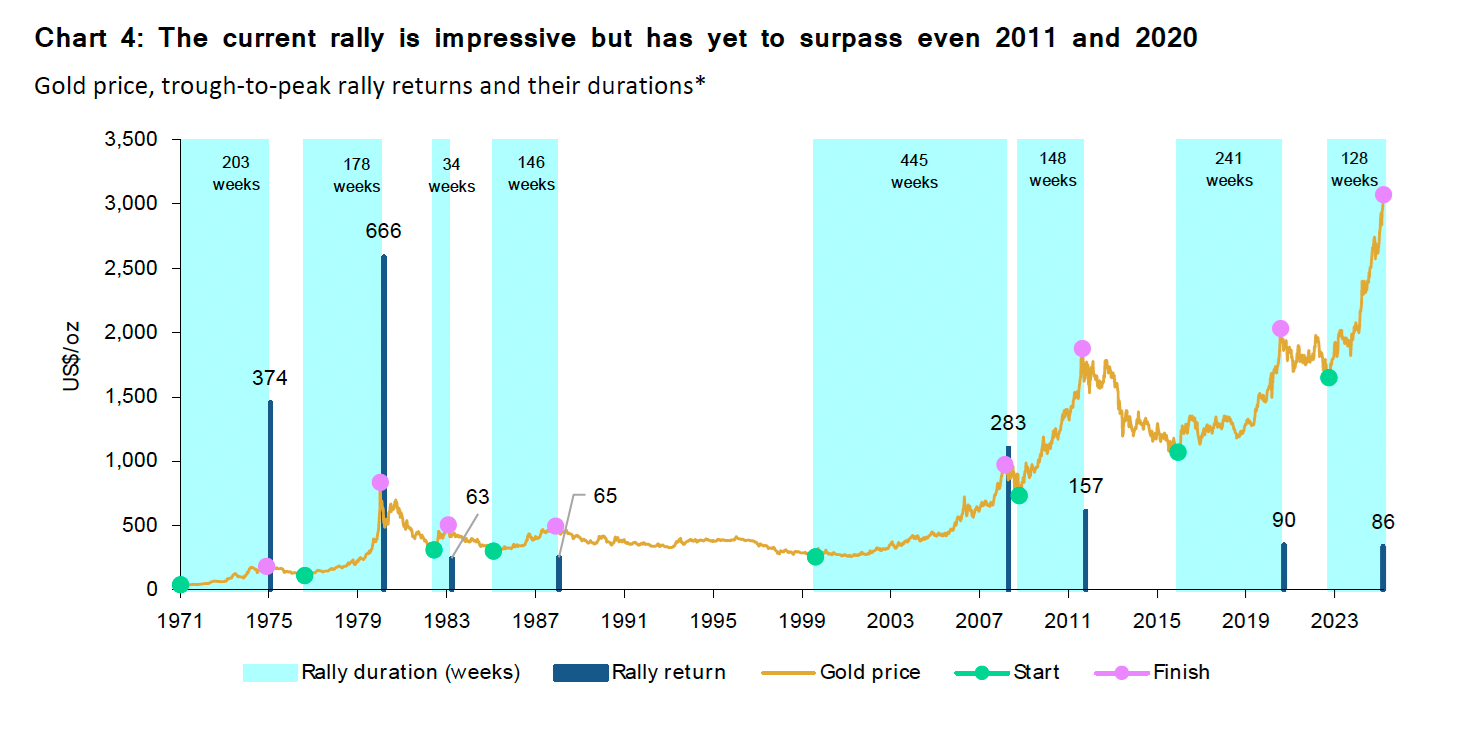
The current run-up in price has taken many by surprise. Paraphrasing an old adage, shouldn’t high prices for a commodity cure high prices? Gold is not a commodity in the traditional sense and primary production’s response may have only limited impact on price. Given current extreme policy uncertainty, the willingness to hold and reluctance to sell could generate real momentum. By historical standards, the current rally isn’t particularly large or long.
Further, comparing the current rally to the peaks of 2011 and 2020 highlights that fundamentals look more solid, and the environment remains supportive of further gains, (Table 3).
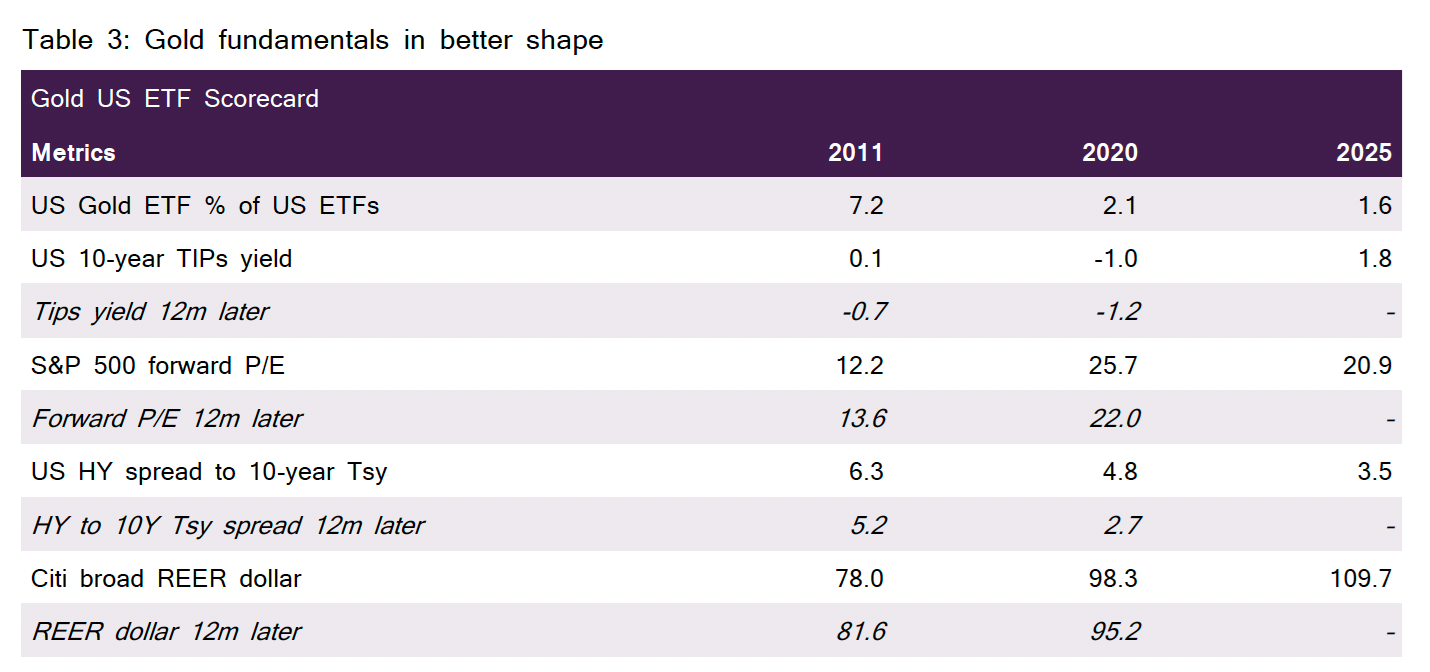
- US gold ETFs are a considerably smaller share of all US ETF assets than during 2011 as ETF buyers have been on the sidelines for the best part of four years they are not overbought.
- Real yields are higher and above their long-run average, suggesting more downside than upside risk for yields – and vice versa for gold prices.
- Forward equity price-to-earnings remains high, providing capacity for further downside to equities should an economic slowdown and earnings downgrades worsen, especially in the current geo-economic conditions, a boon for gold’s safe-haven appeal.
- Credit spreads are considerably tighter than during the two previous peaks. Again, widening risks trump contraction risk, and are also gold supportive.
- The dollar remains elevated relative to prior periods, even if it has weakened since the start of the year. With the Trump administration favouring a weaker dollar and the uncertain effect of tariffs, this could serve as an additional tailwind for gold.
…But not without risks
We also caution that there are risks for the gold price after a rally such as this in such a short space of time.
Treasury managers at central banks could prudently slow their pace of buying given the price rally, as we saw with some central banks last year. While consumer demand adapts to higher prices eventually, the speed of price moves is likely to dampen net buying in the near term. A liquidity crunch could negatively affect gold as the most liquid assets are sold to meet margin calls. Additionally, geopolitical and policy nervousness is elevated, particularly given significant uncertainty about tariffs and their effect on market volatility, which is likely adding a meaningful premium to gold prices. Any resolution could reduce that premium, as seen in previous historical periods.
In conclusion
The extent and speed of gold’s rally have drawn comparisons to previous peaks, (Chart 4). While there are headwinds the gold market must navigate, today’s macro backdrop differs significantly from last peak periods and continues to offer support for gold's longer-term prospects.
Marissa Salim is a Senior Research Lead, APAC, at World Gold Council, a sponsor of Firstlinks. This article is for general informational and educational purposes only and does not amount to direct or indirect investment advice or assistance. You should consult with your professional advisers regarding any such product or service, take into account your individual financial needs and circumstances and carefully consider the risks associated with any investment decision.
For more articles and papers from World Gold Council, please click here.