Register For Our Mailing List

Register to receive our free weekly newsletter including editorials.

Home / 48

Economic growth and equity return outlook

The outlook for global economic growth for 2014 is improving, but is this a good thing for equity returns?

One of the great myths in financial markets, supported by neat textbook theories, is that economic growth somehow drives (or is accompanied by, or maybe is even caused by) corporate earnings growth, and that earnings growth drives stock prices (or at least that expectations of economic growth or expectations of earnings growth drive stock prices). Or perhaps even that expectations of economic growth drive stock prices directly.

None of these assumptions hold true very often in the real world. There is no statistical correlation between economic growth and stock market returns, either at a global level or in individual countries.

The global picture

Economies are highly interconnected and stock markets are also highly correlated.

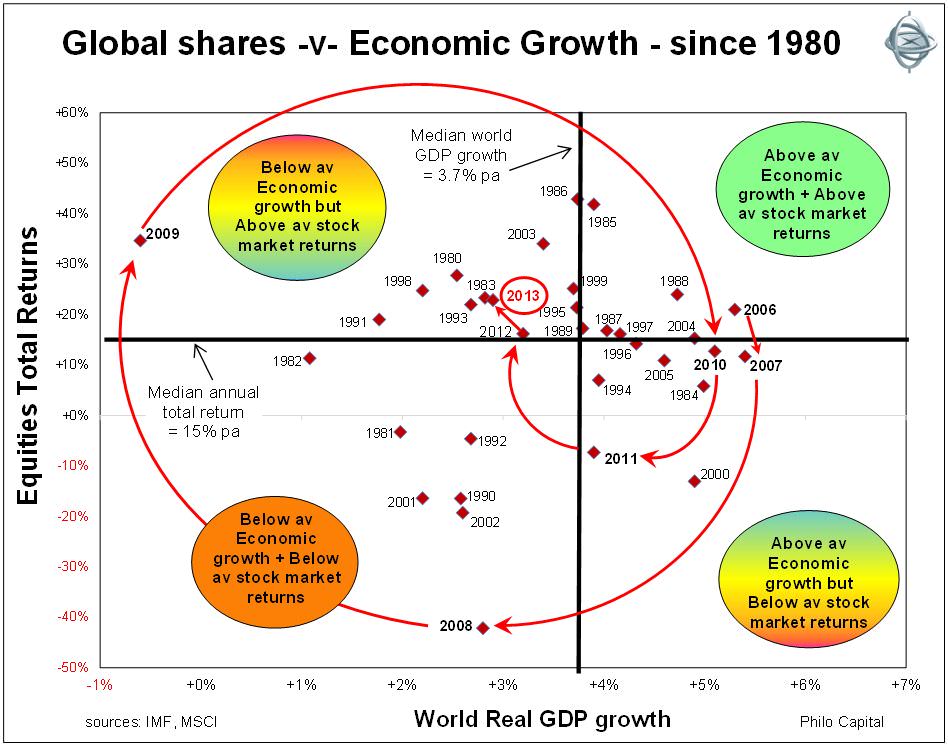
Only rarely does above average world economic growth coincide with above average stock market returns. In only two of the past 34 years since 1980 has this been the case – 1988 and 2006. Also, in only six years has below average economic growth coincided with below average stock market returns – 1981, 1990, 1992, 2001, 2002 & 2008.

In fact at least half of the time when economic growth was above average, stock market returns were below average, and at least half of the time when economic growth was below average (including in recessions), stock market returns were above average.

The following chart shows yearly world real GDP growth and world stock market total returns since 1980:

2013

Last year was similar to several other counter-intuitive years in the recent past. When economic growth slowed and was below average (and earnings growth was very weak) stock market returns were above average. This followed 2012 when economic growth also slowed and was below average, and earnings growth was very poor, but stock market returns were a very healthy 16%.

2011 was also counter-intuitive. Economic growth was above average in 2011 (3.9% compared to a 30 year average of 3.7%) but stock market returns were negative globally.

Going back further, in 2010 global economic growth was above average but stock market returns were below average, and in 2009 world economic growth contracted in the deepest contraction since the 1930s depression but shares had a great year in 2009, with the world market index returning 29%.

Individual Countries

There is a similar story when looking at cross sectional returns in individual countries in any particular year. For example, in 2011 economies almost everywhere grew (except Japan with its tsunami/nuclear crisis), global economic growth was above its long term average, and earnings and dividends grew strongly, but almost all stock markets around the world were down heavily.

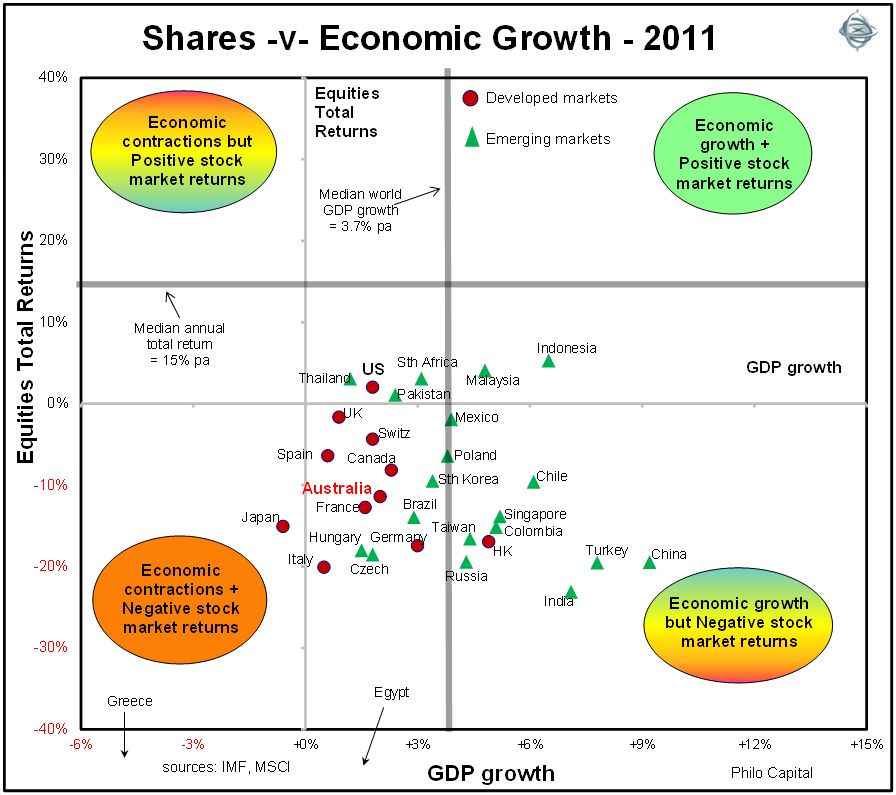
The highest growth economies (China, India and Turkey) had the worst stock market returns. Of the few stock markets that had positive total returns in 2011, only Indonesia posted price gains. In the others (US, Thailand, Pakistan and South Africa) the broad market price index fell, but the addition of dividends helped them scrape into positive total return territory, while Malaysia was flat.

This situation reversed in 2012 when most economies slowed and earnings growth stopped, but stock markets in almost every country boomed.

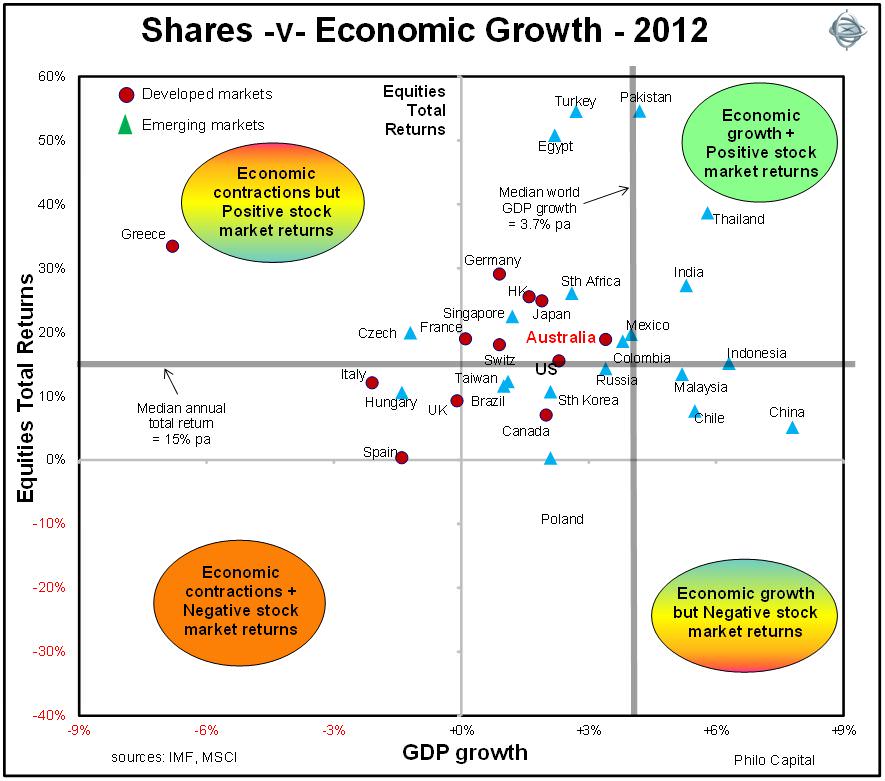
Nearly all stock markets were up in 2012 while economic growth was patchy. US growth was sub-trend, and Europe drifted in and out of recession, with significant contractions in the PIIGS, but equities boomed across these markets. The highest economic growth rate was in China, which had one of the worse stock market returns. The worst economy was Greece, which had one of the best performing stock markets.

2013 was a repeat of this counter-intuitive pattern.

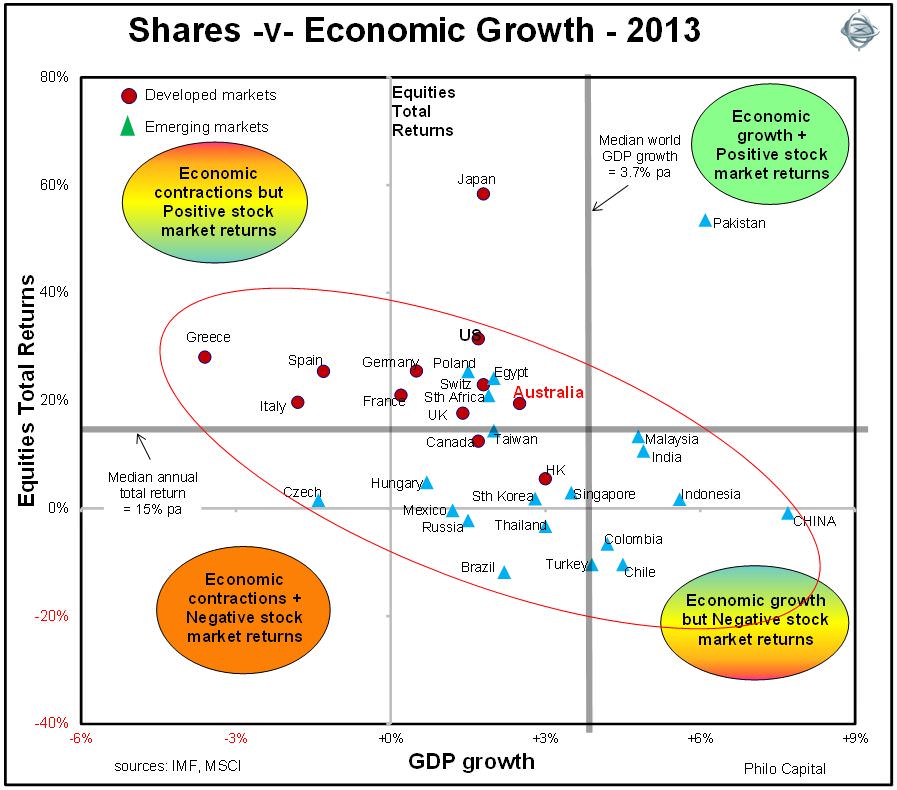
Aside from the two outliers, Pakistan and Japan (for peculiar local reasons), every other major country fell into a band that stretches from top left to bottom right on the chart, with poor economic growth and good stock market returns (top left segment), or good economic growth and poor stock market returns (bottom right segment).

Once again China enjoyed the highest economic growth rate but suffered negative equity returns. Greece, Spain and Italy suffered the deepest economic contractions but enjoyed high equity returns.

If economic growth and stock market returns were positively related, the band would extend from bottom left to top right, but this is not how it works in most years in the real world.

2014?

Today there is a widespread assumption that the outlook for 2014 for improving global growth to a historical average of around 3.6% should be positive for equity returns.

We do not assume that improving economic growth rates will lead to, be caused by, or accompany, good equity returns, as most market economists and equity market strategists do. Instead we view the current consensus outlooks for improving economic growth to around average or trend (ie healthy, or ‘normal’) global growth in 2014 more as a possible warning sign of poor returns.

It pays to think independently and study real world outcomes instead of blindly following convention, market myths and textbook theories.


Ashley Owen is Joint Chief Executive Officer of Philo Capital Advisers and a director and adviser to the Third Link Growth Fund.


5 Comments
Sergey
March 16, 2014

Maybe it is when stockbrokers and fund managers are busy at work (lot of orders to fulfill) they have no time to play with markets, and when they are free from work (when it is slow) they can now finally play with markets? One task at time, is the idea we are looking for here.

Ramzi
February 09, 2014

Is this not a case of stock markets looking ahead 12-18 months from the present. Never satisfied with company returns of the past six months theyre always challenging companies to repeat or improve historical returns. So that when companies are doing well, stock markets are predicting the eventual downturn and when companies are doing badly, markets are looking at the eventual improvement. its a continuous cycle...

David
February 09, 2014

I have always wondered why most equity fund managers include a general "economic update" in their portfolio performance reports? Is the short term economic situation relevant to the performance of their fund, or the market in general? The Philo research would seem to suggest it's not. Are economic updates from fund managers just more distracting "noise" for investors?

Mitchell
February 08, 2014

Markets are an emotional beast. Carry a bag of psychology with you at all times!

Danny Dreyfus
February 07, 2014

Really good article by Ashley, and a reminder of counter intuitive investing (or is that counter cyclical?), and "past performance is no indication of future performance" and so on.


Leave a Comment:

RELATED ARTICLES

Is your fund manager skilful or just lucky?

Four tips to catch the next 10-bagger in early-stage growth

A year like few others, but what's next?

banner

Most viewed in recent weeks

The case for the $3 million super tax

The Government's proposed tax has copped a lot of flack though I think it's a reasonable approach to improve the long-term sustainability of superannuation and the retirement income system. Here’s why.

7 examples of how the new super tax will be calculated

You've no doubt heard about Division 296. These case studies show what people at various levels above the $3 million threshold might need to pay the ATO, with examples ranging from under $500 to more than $35,000.

The revolt against Baby Boomer wealth

The $3m super tax could be put down to the Government needing money and the wealthy being easy targets. It’s deeper than that though and this looks at the factors behind the policy and why more taxes on the wealthy are coming.

Meg on SMSFs: Withdrawing assets ahead of the $3m super tax

The super tax has caused an almighty scuffle, but for SMSFs impacted by the proposed tax, a big question remains: what should they do now? Here are ideas for those wanting to withdraw money from their SMSF.

The super tax and the defined benefits scandal

Australia's superannuation inequities date back to poor decisions made by Parliament two decades ago. If super for the wealthy needs resetting, so too does the defined benefits schemes for our public servants.

Are franking credits hurting Australia’s economy?

Business investment and per capita GDP have languished over the past decade and the Labor Government is conducting inquiries to find out why. Franking credits should be part of the debate about our stalling economy.

Latest Updates

Superannuation

Here's what should replace the $3 million super tax

With Div. 296 looming, is there a smarter way to tax superannuation? This proposes a fairer, income-linked alternative that respects compounding, ensures predictability, and avoids taxing unrealised capital gains. 

Superannuation

Less than 1% of wealthy families will struggle to pay super tax: study

An ANU study has found that families with at least one super balance over $3 million have average wealth exceeding $19 million - suggesting most are well placed to absorb taxes on unrealised capital gains.   

Superannuation

Are SMSFs getting too much of a free ride?

SMSFs have managed to match, or even outperform, larger super funds despite adopting more conservative investment strategies. This looks at how they've done it - and the potential policy implications.  

Property

A developer's take on Australia's housing issues

Stockland’s development chief discusses supply constraints, government initiatives and the impact of Japanese-owned homebuilders on the industry. He also talks of green shoots in a troubled property market.

Economy

Lessons from 100 years of growing US debt

As the US debt ceiling looms, the usual warnings about a potential crash in bond and equity markets have started to appear. Investors can take confidence from history but should keep an eye on two main indicators.

Investment strategies

Investors might be paying too much for familiarity

US mega-cap tech stocks have dominated recent returns - but is familiarity distorting judgement? Like the Monty Hall problem, investing success often comes from switching when it feels hardest to do so.

Latest from Morningstar

A winning investment strategy sitting right under your nose

How does a strategy built around systematically buying-and-holding a basket of the market's biggest losers perform? It turns out pretty well, so why don't more investors do it?

Sponsors

Alliances

© 2025 Morningstar, Inc. All rights reserved.

Disclaimer
The data, research and opinions provided here are for information purposes; are not an offer to buy or sell a security; and are not warranted to be correct, complete or accurate. Morningstar, its affiliates, and third-party content providers are not responsible for any investment decisions, damages or losses resulting from, or related to, the data and analyses or their use. To the extent any content is general advice, it has been prepared for clients of Morningstar Australasia Pty Ltd (ABN: 95 090 665 544, AFSL: 240892), without reference to your financial objectives, situation or needs. For more information refer to our Financial Services Guide. You should consider the advice in light of these matters and if applicable, the relevant Product Disclosure Statement before making any decision to invest. Past performance does not necessarily indicate a financial product’s future performance. To obtain advice tailored to your situation, contact a professional financial adviser. Articles are current as at date of publication.
This website contains information and opinions provided by third parties. Inclusion of this information does not necessarily represent Morningstar’s positions, strategies or opinions and should not be considered an endorsement by Morningstar.