“Should I stay or should I go?” sings Mick Jones in The Clash’s popular 1980s rock song. It is perhaps a question many investors find themselves asking today, when thinking about emerging market (EM) equities. Many EM investors have answered this question already and headed for the exits!
But how should you as an investor attempt to answer this question? Ironically, the very fear that pushes valuations and prices down can also help to reduce the biggest risk that long-term investors face - the possibility of permanent loss of capital. This is most pronounced when an investor pays more for an asset than it is worth.
When investors all head in one direction, it can often be safer to go the other way. Of course, this is highly uncomfortable but as contrarians we believe that discomfort is the reason so few do it and those who do may be highly rewarded.
For long-term investors, the price you pay is almost the only thing that matters
Consider the cyclically-adjusted price-to-earnings (CAPE) ratio (also known as the Shiller P/E), a well-established barometer of how expensive a market is. It is not only helpful in telling us if a market is expensive or not, but has also shown to be a helpful tool to forecast long-term equity returns.
A 2012 study by Klement, titled Does the Shiller-PE work in emerging markets, found that the CAPE ratio was a reliable long-term valuation indicator to predict future real returns not only in developed markets (DMs) but also in EMs. The same study found that the correlation between the CAPE ratio and future real returns is low over shorter investment horizons, but is much higher (averages around 0.7) over longer investment horizons of five years and more, in both DMs and EMs.
Similar to the CAPE ratio, a 2017 study by Keppler and Encinosa, called 'How Attractive Are Emerging Markets Equities? The Importance of Price/Book-Value Ratios for Future Returns' showed that there was a negative relationship between the price-to-book (P/B) ratio of the MSCI EM Index and the subsequent returns in US dollars over the next four years, over the period January 1989 to October 2016.
In other words, the lower the starting P/B ratio is, generally the higher the subsequent returns over the next four years and vice versa. The same authors also found the same relationship in the United States over the period 1970 to October 2016.
EMs appear to be cheap on an absolute and relative basis
As shown in Figure 1, EMs in aggregate traded at a CAPE ratio of around 12 at the end of June 2020, which is low versus its history and at a similar level reached during the GFC. In contrast, the US market traded at a ratio of close to 30, much higher than its long-term average of around 17. In short, EMs trade at low levels when looking at the CAPE ratio, both on an absolute and relative basis.
Figure 1: EMs trade at low valuations relative to history
The CAPE ratio for the US and EMs, June 2020
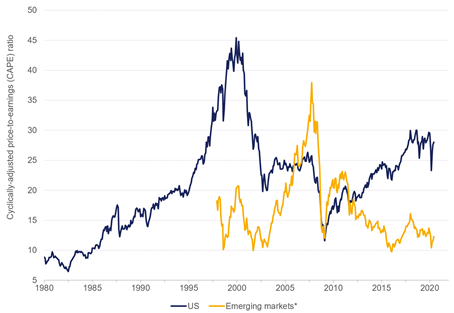
Source: Minack Advisors, MSCI, National Bureau for Economic Research. Data as at 30 June 2020. CAPE ratio is based on trailing operational earnings. *US$ price index, with index and cyclically-adjusted earnings deflated by US Consumer Price Index.
Like many valuation metrics, the CAPE ratio has limitations and investors should never rely on a single metric. The good news here is that EMs are also attractive when evaluated using other metrics, such as the P/B ratio. Figure 2 shows that EMs trade at around a 35% discount to DMs on a P/B basis as at 30 June 2020. This is lower than the long-term average discount of around 28% (since the end of 1996). Admittedly, this is not as low as the discount levels reached during the Asian Financial Crisis in the late 1990s, arguably a once in a lifetime buying opportunity for Asian equities.
Figure 2: EMs also appear cheaper than DM’s
The P/B discount or premium of MSCI EM Index relative to MSCI World Index, 1996 to June 2020
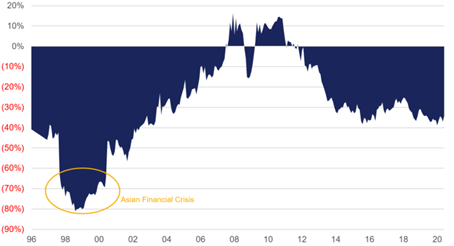
Source: Bloomberg, Orbis. Data as at 30 June 2020.
From starting valuations like these, investors in EMs may be handsomely rewarded
Keppler and Encinosa also found that when the P/B ratio fell between 1.22 and 2.76 (the range we find ourselves in today, with the MSCI EM Index trading at around 1.6 times at the end of June 2020), the average total annual return in the four years that followed was 9.4%. Although, the study also found that there was a wide range of potential outcomes.
Furthermore, the subsequent 10-year return in US dollars is also clear, that at the current P/B valuation level, the outlook for EM investors looks promising over the long-term.
The cheapness in EMs isn’t justified by its fundamentals
Of course, low valuations alone are not necessarily enough to make an investment case. If fundamentals are diminished, then investors would simply be paying less for lower quality companies.
As shown in Figure 4, EMs trade in aggregate at more attractive and favourable multiples than most other regions globally. For example, the median stock in EMs trades at a lower multiple of earnings (the normalised price-to-earnings (P/E) ratio for EMs is around 21 times versus 27 times for the FTSE World Index) at the end of June 2020, despite being fundamentally better businesses – as demonstrated by having grown revenues at a faster average rate over the past 10 years, despite lower levels of debt.
Figure 4: EM’s in aggregate trade at attractive fundamentals versus other regions
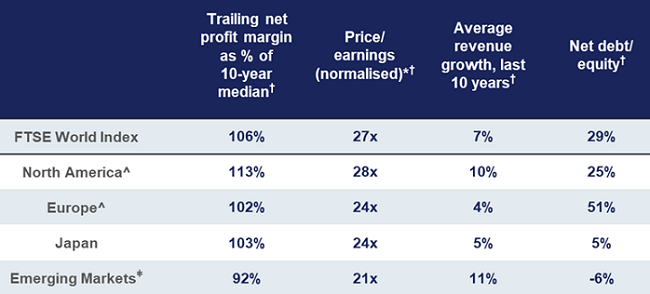
As at 30 June 2020. Source: Worldscope, Orbis. In each case, calculated first at the stock level and then aggregated using a weighted median. Statistics are compiled from an internal research database and are subject to subsequent revision due to changes in methodology or data cleaning. *Earnings are normalised by multiplying each company’s trailing revenue-to-price multiple by its median 10-year net profit margin. †For non-financial companies. ^Excludes emerging markets.
EMs appear cheap on both and absolute and relative basis when looking at both the CAPE and P/B ratio. Both metrics have historically proven to be good predictors of long-term returns. Furthermore, it does not appear that the average company found within EMs is of lower quality, with EMs trading in aggregate at more attractive fundamentals versus other regions.
Of course, investors should be wary of piling into the market blindly. In our view, there are plenty of exciting opportunities within the EM universe but in selected parts of the market.
NetEase: a quality business with long-term growth potential
A small number of companies exposed to the Chinese internet sector look attractive and trade at a significant discount to our assessment of intrinsic value. A good example is NetEase, a provider of online games, education, and entertainment. Founded in 1997, today its key businesses are all delivered online and therefore almost custom-made for a world in lockdown.
In our view, a combination of secular tailwinds and its proven game development capability should drive the growth of its core online gaming business over time. In addition, it also has some exciting new ventures that are currently loss-making, but which we believe offer substantial long-term upside potential.
After adjusting for cash, NetEase traded at around 19 times our estimate of 2020 earnings of its core games business (at the end of June 2020). We believe this is an undemanding valuation for a resilient business with long-term growth potential, and a rock-solid balance sheet with net cash equivalent to about 20% of its market value. The US-China tensions have been a concern of late for investors, but we think that the fundamentals of NetEase are generally less exposed, given the company provides most of its services domestically.
Please stay, don’t go!
We think EM offers investors with a better chance of generating meaningful returns over the long-term starting at today's levels. There is no doubt that EM equities do come with additional risks often related to economic or political instability. But the risk that really matters to investors is not the short-term uncertainty, but the possibility of permanent loss of capital, which occurs when you pay more for an asset than it is worth.
Fortunately for investors today, after a prolonged period of relative underperformance versus DMs, the risk of overpaying now appears to be well below-average. While most investors have chosen 'to go', we think that the facts support the opposite conclusion: investors should instead choose 'to stay'.
Shane Woldendorp, Investment Counsellor Group, Orbis Investments, a sponsor of Firstlinks. This report contains general information only and not personal financial or investment advice. It does not take into account the specific investment objectives, financial situation or individual needs of any particular person.
For more articles and papers from Orbis, please click here.