Contrary to the popular belief that 'zombie companies' are increasing rapidly, the number has been relatively constant over the last decade, suggesting that the risk to portfolios is not as concerning as some might think.
Zombie companies are those that would normally have gone bankrupt or faced restructuring but have been kept alive by sympathetic credit policy and interest rates which are artificially low.
Zombies usually small companies
While some commentators have expressed concern about a rise in such companies in recent years, our recent analysis shows that this phenomenon has been remarkably steady among mid- and large-cap companies, and the descent into zombie territory is mostly confined to a long tail of small players.
In a paper from the Bank of International Settlements, Banerjee and Hoffmann found the percentage of zombie firms has been increasing steadily for many years to what appears to be alarming levels. In our new paper, we set out to test this conclusion with our own, broader data set and to see if this exposed our investments to significant portfolio risk.
We found that the problem was far less of an issue when low-quality ‘penny dreadfuls’ and other small firms were excluded.
Defining the data set
The Banerjee and Hoffmann dataset was confined to 14 countries and used all listed companies regardless of size, quality or whether they can be easily traded. This created a total of 32,000 that includes even the smallest firms.
Our data set is broader, covering almost four times as many countries across developed markets (24 countries, 13,000 stocks), emerging markets (29 countries,10,550 stocks) and Australia (1,000 stocks), from 1999 to 2019. However, it does not cover as many names - we concentrate on larger, more investable stocks, with a total of approximately 25,000.
There are many ways to define a zombie firm, but our primary measure is closest to the 'narrow' definition of Banerjee and Hofmann and consists of:
- Three consecutive years of interest cover (IC) less than 1
- ‘Tobin’s Q’, which is a ratio of market value (what the market thinks it’s worth) to book value (its value as recorded in the financial statements). We looked at where this was less than sector average
- Firm age greater than three years.
Using this definition and our revised data set, we see that the number of zombie firms has actually been quite consistent over the last decade, as shown in Figure 1.
Figure 1: Percentage of Zombie Firms 1999-2019
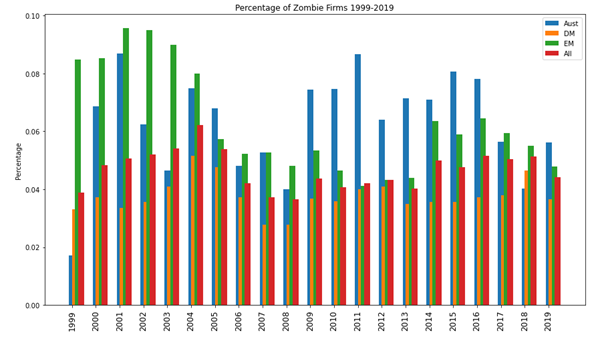
Source: Realindex, data as at 31 December 2019
Note the data does not include 2020 and the stresses brought about by COVID-19. However, the definition of three years of consistent underperformance allows for one-off events to interrupt a company’s operations.
Overall, these results provide some interesting insights:
- We do not see the increasing trend to zombie firms within developed markets that Banerjee and Hofmann see. The proportion is fairly stable over the last decade at around 4% of the universe in each year.
- Emerging market zombies were a large proportion of the universe in the early 2000s, but that trend has also moderated in the last decade.
- Australian zombies were a large proportion of the universe post GFC, but even that proportion has fallen in recent years.
- On average, Australian firms are more likely to be zombies than the other universes. (Full sample percentages: Australia 6.4%, developed markets 3.6%, emerging markets 6.3%, all stocks 4.6%, US 3.7%, Japan 0.8%). The data suggests this is largely a sector effect. The materials, energy and consumer staples sectors all have a higher proportion of zombies, and these sectors are well-represented in the Australian market.
Overall, the lack of this previously observed developed market zombie trend is somewhat surprising, but should be comforting to economists and investors alike.
Size matters: smaller firms drive the ‘undead’ phenomenon
A possible explanation is the different data sets we use. The Realindex data set is across all 24 developed market countries and is probably much more large-cap focused than (for example) Banerjee and Hofmann. This size effect is examined below and this seems to yield a partial explanation for this difference.
To look at this, we divide our developed markets universe up into deciles (10 percent bands) by market cap at each year (as indicated in the Legend), and then calculate the zombie percentage in decile.
Figure 2 shows the results:
Figure 2: Zombie percentages by large and small cap
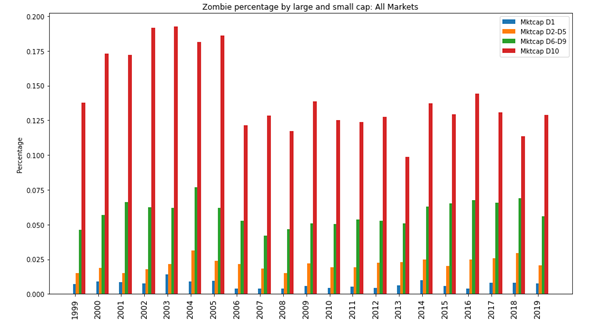
Source: Realindex, data as at 31 December 2019
Previous research has shown that the zombie firm effect has a significant small-cap bias, which we can also see here. In fact, the results are dominated by small caps. However, the recent increasing trend in zombie firms is only seen in the smallest 10% of developed markets stocks, which suggests that this effect is small cap only. The proportion of large cap firms which classify as zombies is small.
This is a useful insight when considering the risks posed to portfolios in a period of cheap, easy credit and generous government support. The key is to look to mid- and large-cap companies to avoid the risks of high debt, poor management and low earnings that combine to keep a company on life-support. Of course, this would be a useful approach in any investment process, regardless of the investment style.
This paper follows an earlier study entitled “COVID and Credit and Zombies” (Realinsights Deep Dive, 10-2020). Here, we use Realindex data to investigate some of the empirical nature of the zombie companies’ phenomenon in more detail.
David Walsh is Head of Investments at Realindex Investments, a wholly owned investment management subsidiary of First Sentier Investors, a sponsor of Firstlinks. This article is primarily for information. It discusses ideas that are important to the Realindex investment process and clients but may not be affected in the ways discussed here.
For more articles and papers from First Sentier Investors, please click here.