Just as it is dangerous for anyone to argue “It’s different this time”, it is similarly risky for technology sceptics to doubt what may seem like absurd ideas. For example, should anyone laugh at Elon Musk’s latest claim that Teslas get better with age as software upgrades improve the car’s functionality?
This battle between reality and hope, with the realists often looking as silly as the evangelists, is a constant in technology and technology investing. Technology has changed the world and created substantial value. Yet, tech history remains littered with the likes of Blackberry, Nokia and Geocities. The latest (modest) sell-off in technology is a good time to reflect on the value created by technology and where we currently stand.
Technology has supported much of the improvement in equities from 2009. The S&P 500 Information Technology index has risen 301% since March 2009, compared to 202% for the broad S&P500 index. In the last 12 months, returns in technology of 30% were double those in the index to the end of May.
Performance of US tech stocks vs. the US market
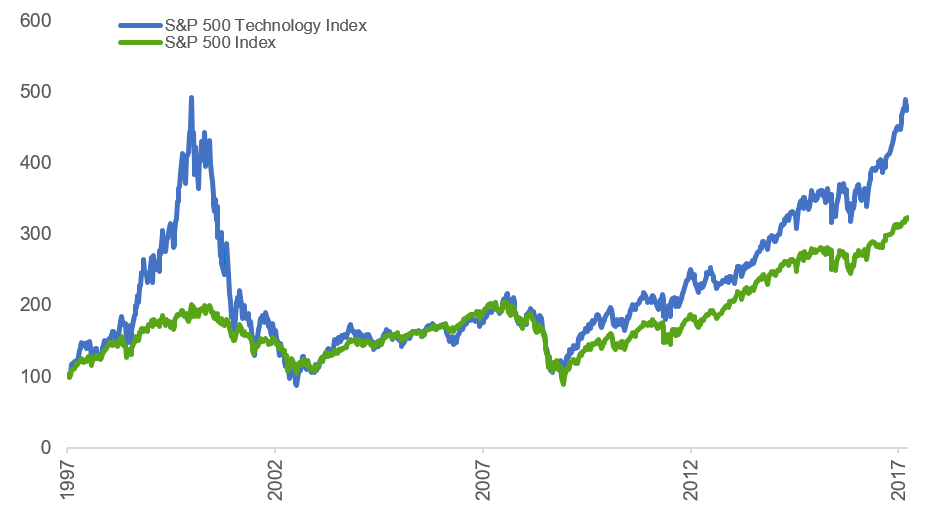
Source: Bloomberg, weekly data, index = 100 @ 31 Mar 1997 to 19 Jun 2017
The evangelist and the realist
The balance between realism and evangelism is the combination of valuation and earnings. Fortunately, we have a benchmark for extreme evangelisation, the dot-com boom of the late nineties. From a valuation perspective, today in no way matches the experience of 1999. Yes, valuations have risen recently, but for both Price to Earnings and Price to Sales, the increase is barely noticeable by comparison. The Price to Earnings for the S&P500 Information Technology peaked at 80x and the Price to Sales peaked at a little over 7x around the year 2000. By contrast, today, the index is at 24x earnings and 4x sales.
Valuations of Tech stocks now (green line) vs. pre-2000 (blue line)
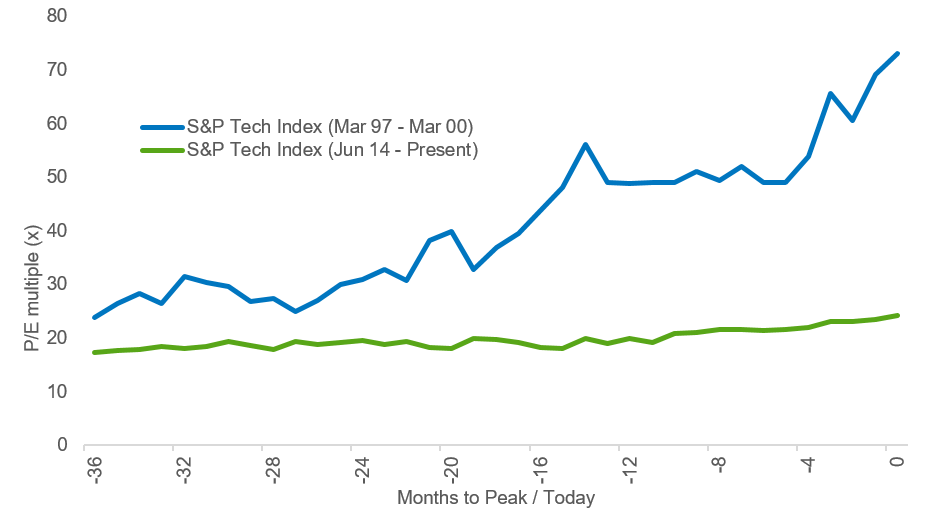
Source: Bloomberg, CFSGAM, valuations to Mar 2000 peak vs. valuations to 31 May 2017
So it is not a bubble. Indeed, it is possible, depending on your earnings view, to say that valuations in the expansion from 2005-2007 were slightly higher (with earnings higher than in 2000) than they are today.
But not being a bubble does not mean valuations are cheap. Much more important are earnings and their trajectory, and it’s useful to look at four leaders from 2000 against two from today’s FANG (Facebook, Amazon, Netflix and Google).
It is not clear from this analysis that the big constituents of 2000 were not as profitable as Facebook and Google are today. Gross margins were a little volatile around 2000 but future margins, which matter to long-term investors, have maintained high levels and greater stability. The ongoing profitability of Microsoft, Cisco, Oracle, and Intel (MCOI) is remarkable.
The evangelism of 2000 was misplaced yet the scepticism of 2010 and 2011 when valuations were at their lowest, was similarly misplaced. Oh, to have bought Facebook in September 2012!
Gross margins of the major tech companies from the year 2000 to now
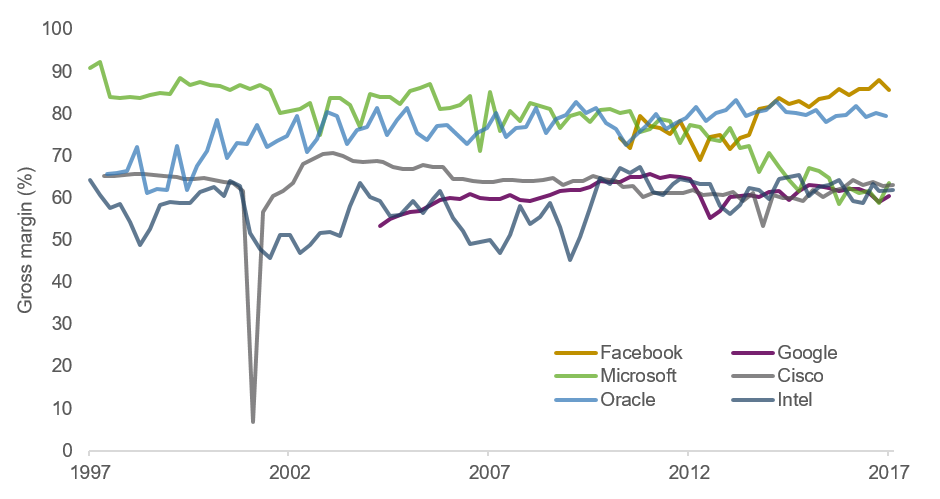
Source: Bloomberg, MCOI vs. Facebook & Google, quarterly data (%), Mar 1997 - Present
The fundamental evangelist: Facebook, Adobe and Nvidia/Micron
The profitability of the industry as a whole reflects two consistent themes across a variety of sub-sectors: strong demand for products and services with increasing utility and high margin business models. For example, four companies across three sectors include Facebook on the Internet, Adobe for enterprise software and Nvidia/Micron in semiconductors.
Facebook
Facebook is a dominant player in contributing to substantial productivity improvements generated from the sharing of information and commerce.
“But the kids don’t like Facebook anymore”. This standard view misses the essential value of Facebook to its users, shareholders and the broader economy. To go all evangelist, Facebook is the social network or, alternatively, social infrastructure, creating value as users’ bulletin board. These interactions provide Facebook with the ability to offer advertising that is extremely well targeted, with businesses receiving high, measurable Returns on Investment. Many of these advertisers are new advertisers looking to advertise to a customer base that is geographically close. Facebook is changing the world, but more importantly, it is changing your neighbourhood.
The resulting profitability, particularly in the US, is astounding. Each user in the US attracted $67 in advertising in the 12 months to March 2017.
Facebook’s profitability growth depends on finding new use cases and building a sales infrastructure. The monetisation of Facebook Messenger is a good example of new use cases. The forced adoption of Facebook Messenger has been the fastest adoption cycle in internet history. It allows Facebook to drive transactions in ways similar to WeChat in China. For instance, the e-gaming company Activision used a chat bot to engage with users via Facebook Messenger. In the first 24 hours, the chat bot had six million interactions. Similarly, tools that improve the quality of advertising enable smaller and smaller businesses to have a professional online presence.
Adobe
Enterprise software is a key productivity theme in the technology sector. Firms are continually looking for ways to improve their business processes to focus on and invest in the things that matter: product development, product marketing and customer service. Adobe not only improves efficiency in many marketing functions, it also adds value to the process.
Demand for Adobe’s product comes from increasing online content, especially as the demand for professional content rises similarly. Adobe delivers that content. It uses a Software as a Service (SaaS) business model where it charges users an annual subscription for access to its Creative Cloud. Since 2014, revenue from the Creative Cloud has risen 75% on a gross margin of greater than 65%.
The use of the Cloud to drive growth for Adobe highlights two key points: new use cases and the explosion in data creation. Adobe now uses Machine Learning to help improve searches of its stock photo gallery, which in turn requires greater data storage and computing power.
Adobe Digital Creative revenues
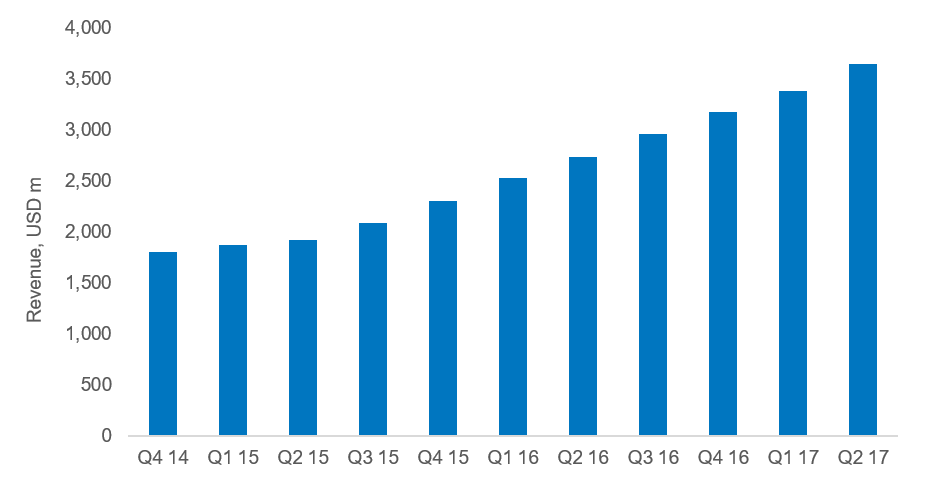
Source: Adobe, Bloomberg, rolling four quarters (USD million), Nov 2014 - Jun 2017
Semiconductors: Nvidia and Micron
Semiconductors are the ‘picks and shovels’ of information technology. As the uses of the internet, software and computing power expand, they drive an increasing requirement for data. At the heart of data processing is the chip.
In early 2016, the market expected stable to lower demand for semiconductors over the next two years. The price of DRAM and 3D Nand had collapsed, and smartphone demand seemed to be tailing. Instead, growth has improved as new use cases for semiconductors have emerged. It started with Nvidia’s new chips for gaming but has morphed into cars, data centres, machine learning, a doubling in the memory on a standard smartphone, increasing use of sensors in industrial processes and payments. It has also emerged in demand for crypto-currency mining.
Importantly, it has also occurred at a time when the industry is as under-invested as it has been in some time. Semi-conductor companies have entered a period of demand with limited plans for capacity growth. For once, the industry seems capable of benefiting from a demand upswing.
Conclusion
Technology evangelism has been a formidable strategy over time. Amazon was $107 at the peak of the dot-com boom in March 2000, and it hit $1,000 in June 2017. That is a 13% CAGR for 17 years. And, if you bought at the bottom, the CAGR is 39%. But there have been other disasters, and every so often, a little realism does not hurt.
James White is a Portfolio Manager with Colonial First State Global Asset Management.