What’s war good for? With apologies to Motown songwriters Norman Whitfield and Barrett Strong, absolutely nothing from humanity’s point of view.
While the human cost of conflict - measured in lives lost, families displaced, and immense suffering - is profound and undeniable, the historical relationship between geopolitical chaos and long-term equity market valuations is remarkably detached.
This is perhaps because markets grind on, focused on profits and with what appears to be indifference to the tragedies that dominate the headlines.
Historically, at least, equity markets decline ahead of conflict as investors brace for the unknown, but rally during it, often led by rotations into sectors or industries that profit from the chaos.
Today, many investors are asking whether the current Middle East conflict will reveal markets to be equally resilient (and indifferent).
Before we dive in, it’s worth making a few observations about the current conflict in the Middle East.
The first is the resulting oil supply shock is likely to trigger price rises across many goods. It is already increasing the price of money as interest rates rise, and in so doing, causing the cost of capital to rise.
This can have consequences for merger financing, which in turn will hurt deals, hurt the prospects for bailouts, and, through the impact on the very wealthy, challenge confidence in political leaders worldwide, especially those aligned with Trump.
In fact, it’s reasonable to conclude that many of the follow-on effects of this supply shock are adverse, including the impact on living standards across the world.
The World Wars’ impact on markets
During the two World Wars, the US stock markets generally performed positively despite initial panic. In World War I (1914–1918), following a 30% drop when markets reopened after the war broke out, the Dow Jones rebounded significantly, rising 88% in 1915 alone and finishing the period with a 43% gain (8.7% annualised).
In World War II, despite a 4.37% drop after Pearl Harbour and volatile periods like the fall of France, the Dow gained 50% (7% per year) by the end of the conflict.
Importantly, the United States’ entry into World War II saw equity markets reach their low point in 143 days and return to higher ground within a year.
Combined, equity markets displayed resilience through high volatility, often turning early losses into long-term gains.
Despite these encouraging stats for investors, I think it’s reasonable to ask whether a world war in 2026 or 2027 would result in equally resilient stock markets. Drones, autonomous soldiers, artificial intelligence (AI) and the ever-present threat of nuclear ‘solutions’ make World War III a far less palatable prospect, even for investors.
But the current conflict in the Middle East is not a world war and doesn’t appear to bear the essential ingredients for one to start. Yet. A defining feature of world wars is the formal commitment of multiple global superpowers to fight on behalf of their allies. And unlike the pre-nuclear era of 1914 or 1939, the presence of nuclear weapons among major powers (the U.S., Israel, Russia, and China) acts as a catastrophic deterrent.
2026: the year of diversification
I’ve written extensively about the current Middle East conflict, oil, US inflation, AI, the associated SaaSpocalypse, US debt, Gold and the de-dollarisation trade, and long bond yields. And while many of those topics allude to the need for diversification, we were also much more specific. Earlier this year, I explained that 2026 would be the year when investors would benefit from some earlier tactical diversification into investments uncorrelated with public markets – such as private markets and alternative investments.
The arguments were relatively straightforward: an unpredictable US president, mid-term election years tending to be tougher for equities - especially between May and September, weaker equity markets and larger drawdowns during Republican presidencies going back 125 years, a fourth consecutive strong year in equity markets being an exception and very stretched stock market valuations.
With the S&P 500 down 7.14% and the ASX 200 down 3.23% year to date, there’s not much in returns, so far, worth writing home about. But the S&P 500 is now down 8.7% from its 2025 high and the ASX 200 is 8.2% lower.
Quality suffers
Perhaps that, and the palpable investor anxiety, as well as the poor showing by quality-biased active equity managers (Table 1), especially over the six and 12 months to the end of February 2026, is worth writing about.
Table 1. Australian quality-biased active manager performance
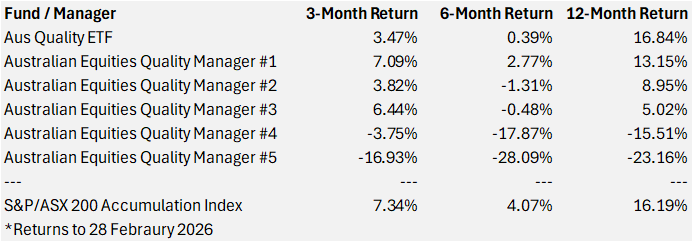
Table 1 highlights the recent challenges faced by quality-based managers in Australia. Over three months and six months, the ASX-listed domestic quality-based exchange traded fund (ETF) has materially underperformed the S&P/ASX 200 Accumulation Index. Over three, six and twelve months, all active quality-based active managers have underperformed the broader index.
Keen observers will note the Aus Quality ETF actually outperformed the broad index over 12 months (16.84% vs 16.19%), suggesting that while active managers might have struggled with idiosyncratic factors, the broader ‘quality’ factor held up slightly better over the full year before deteriorating in the more recent 3-to-6-month window.
The recent performance of active managers is driven by three specific market dynamics that typically disadvantage the ‘quality’ investment style.
The first is that the ASX 200 is heavily weighted toward Financials and Materials (Mining).
If the broader market is driven by a surge in cyclical sectors - such as a spike in iron ore prices or a recovery in banks - the Index will climb rapidly, and with quality managers typically avoiding highly cyclical or capital-intensive companies, their portfolios will naturally fall behind.
Secondly, ‘quality’ stocks - those, for example, with high Return on Equity (ROE) and stable earnings - often trade at a premium, and in periods where the market favours value or questions growth, those premiums will contract, as they have done recently.
Table 1., reveals a particularly harsh 6-month period for managers, which suggests a questioning of, and sharp rotation away from, quality earnings toward other market segments, in this case energy, materials and businesses less likely to be disrupted by AI.
Finally, there’s interest-rate sensitivity for quality companies because their growth premium is vulnerable to rapid rises in interest rates or bond yields. The present value of their future cash flows is discounted more heavily, which leads to a "de-rating" of quality stocks even if the underlying companies are performing well operationally.
Recent conflicts and returns
In February 2022, when Russian tanks rolled into Ukraine, the S&P 500 subsequently sold off 16%, bottoming in June 2022 before rallying 16.5% and then beginning a more significant decline into October 2022 as interest rates were raised to fight the inflation after-effects of COVID-19.
During that period, the domestic ASX 200 fell 3% between 18 and 25 of February, rallied 7.5% over the next two weeks, and then declined 14% to the end of September 2022 in sympathy with overseas markets and in reaction to rising interest rates.
Given persistent inflation and the central bank responses globally, we cannot say with certainty how much of the moves were related to the war in Ukraine.
What we can say, however, is that interest rates were also a factor in many other past geopolitical conflicts, and despite this, a pattern emerges that might give investors some encouragement. We can also say that rising or high rates are a familiar factor today as the Middle East conflict devolves.
Table 2. S&P500 response to geopolitical events
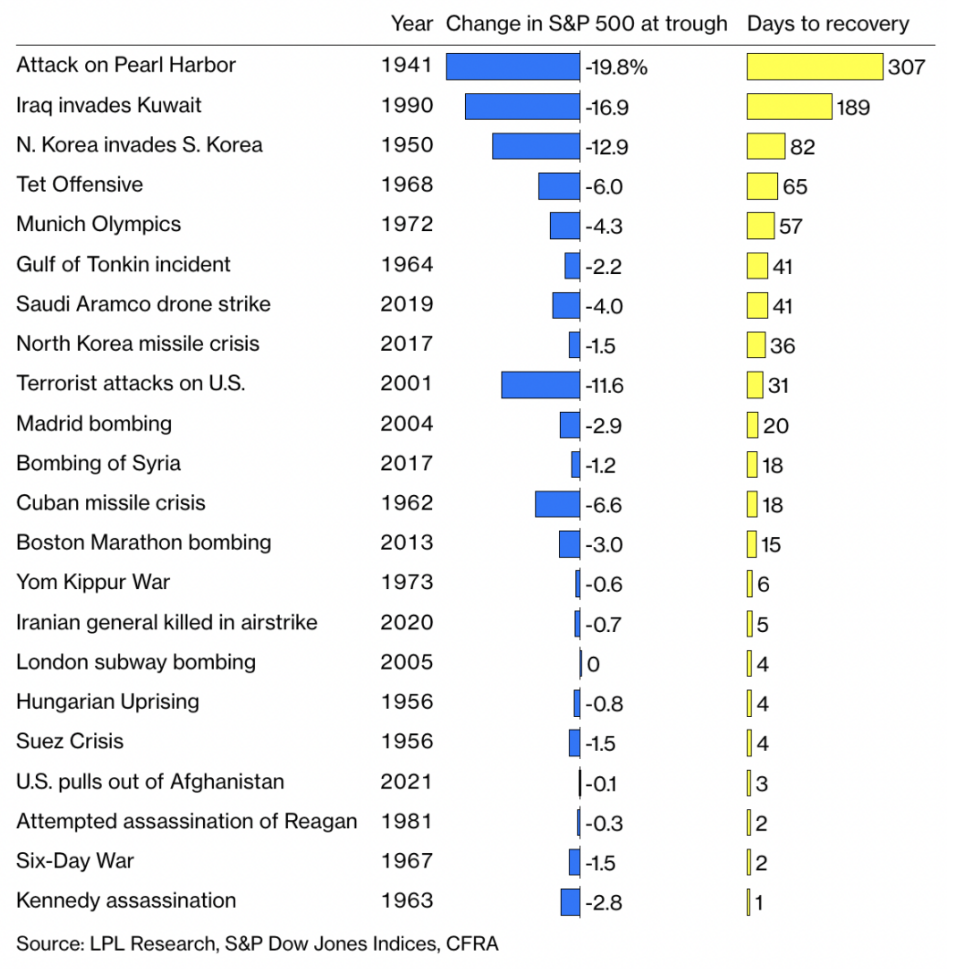
As Table 2, reveals, data provided by market strategist Ryan Detrick at LPL Financial, a leading US wealth management firm, highlight the resilience of equity markets across decades of volatility. In his 2022 analysis of 22 major non-financial shocks dating back to the attack on Pearl Harbour, Detrick found that the immediate market reaction was often a brief, sharp dip followed by a swift recovery.
On average, these events triggered a one-day loss of just over 1%, with total drawdowns bottoming out at less than 5%. Of course, that’s already been exceeded in this 2026 conflict, revealing the limitations of averages. Perhaps most surprising, however, is the speed of past rebounds; it typically took fewer than twenty days to hit the floor and only about six weeks to bounce back entirely.
This pattern of resilience is heavily influenced by geography and economic scale. The United States enjoys a unique position as an isolated superpower, making existential threats to its currency or markets relatively low compared with those of more vulnerable nations.
The historical record for smaller or more centrally located countries is grimmer; investors in Poland in 1939 or Russia in 1906 faced catastrophic losses that were not easily erased by a quick market bounce. Furthermore, while a country like Russia has a gross domestic product (GDP) comparable to Canada’s - a relatively small piece of the global pie - the danger lies in how a localised conflict might escalate or disrupt broader supply chains.
It’s worth acknowledging a small economic engine like Iran can still throw a massive spanner into the global works if the war expands beyond its initial borders, adversely impacting supply chains, which the current conflict has already done.
Ultimately, the takeaway for today’s equity investor is not to become callous or complacent, but to recognise the danger of making emotional trades based on the morning's headlines. Drawing a straight line from a tragic news event to a portfolio strategy is a path fraught with error, as markets have a storied habit of stumbling over the immediate headline only to return to focusing on profit growth and thematics a few weeks later.
Despite the constant hum of geopolitical commentary in our news feeds, successfully trading on these forecasts remains notoriously difficult. Markets are inherently forward-looking, and they tend to prioritise commerce over the temporary, albeit terrifying, noise of conflict.
And history seems to favour investors who consider a five-or ten-year view and take advantage of the chaos, rather than those who react emotionally.
Further encouragement
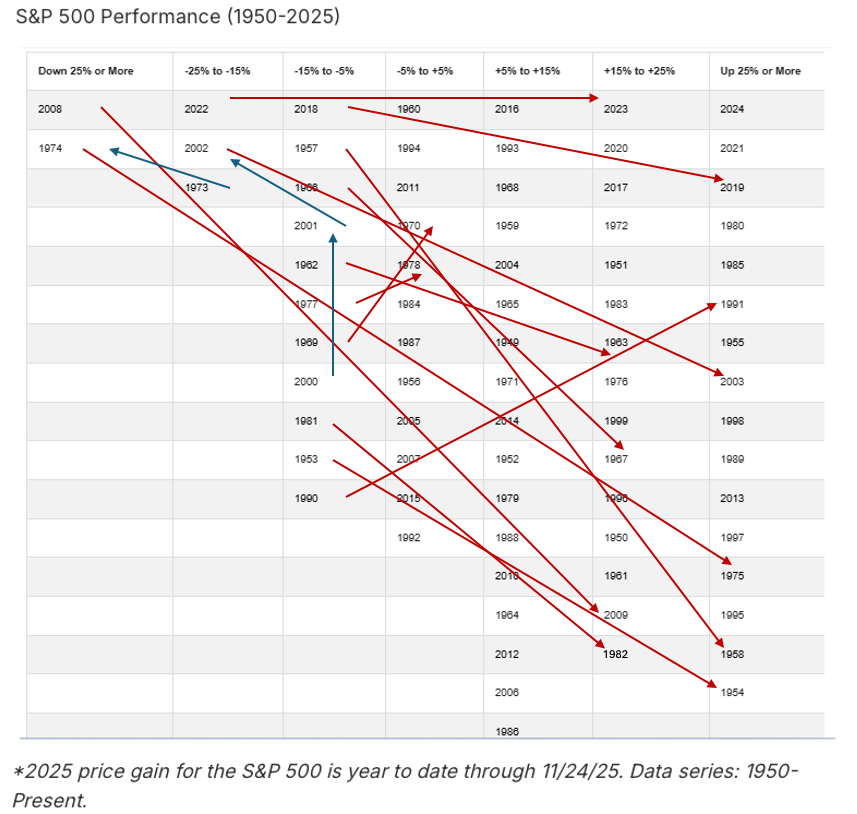
For committed share market investors and those for whom a ‘tactical’ response is anathema, it’s still worth knowing the pattern of historic returns, particularly what tends to happen after a very weak year.
As Table 3, shows, very weak years in markets are usually followed by very good years. In fact, since 1950, there have been sixty years that produced returns of greater than -5%. Notably, however, there have been sixteen years in which the S&P500 has fallen by more than 5%.
Of those 16 years in which the S&P500 fell by more than 5%, only three were followed by another negative year. Of all negative years greater than 5%, 81% were followed by a positive year and all but two produced a return greater than 15%.
Source: LPL Research, Montgomery
Conclusion
If the Middle East conflict proves to be as temporary as weak stock market years, investors could be cheering - as history suggests markets may recover more quickly than expected.
At the same time, markets often detach from the human reality of these events, making emotional reactions costly.
For investors, the lesson is to remain disciplined, avoid emotional decisions, and ensure their portfolios are thoughtfully diversified.
Roger Montgomery is the Founder and Chairman of Montgomery Investment Management, a leading Australian boutique investment manager, which offers investors access to high-quality investment strategies in Australian equities, private credit, and digital assets. Roger is widely regarded as one of Australia’s most insightful professional investors and thought leaders. He is the author of the best-selling investment guide Value.able and is a well-known media personality in Australia.
For more information, contact the Montgomery Team on (02) 8046 5000 or [email protected] or visit www.montinvest.com
Sign up for Roger’s insights at www.rogermontgomery.com
This article is for general information only and does not consider the circumstances of any individual.