Register For Our Mailing List

Register to receive our free weekly newsletter including editorials.

Home / 434

Why starting points matter

It’s why millions of dollars are spent on Grand Prix qualifying cars and house prices are higher near good schools. The better your starting point, the more likely you are to succeed.

Long-term investing is no different. The lower the starting price of an investment, the better it is likely to do, all else being equal. At its heart, a company’s stock price is made up of not just of what its assets, ideas and people are currently worth, but also the profits the market expects it to generate in the future.

Is the value already in the price?

The higher the valuation, the more of those future earnings are already included in the price and the better the company has to do just to meet those inflated expectations, let alone surpass them. In addition, the higher investors’ expectations, the greater the number of possible scenarios wherein the company disappoints the market. Conversely, the lower the starting price, the less the company has to do to beat low expectations.

When it comes to long-term investment returns, your starting point matters

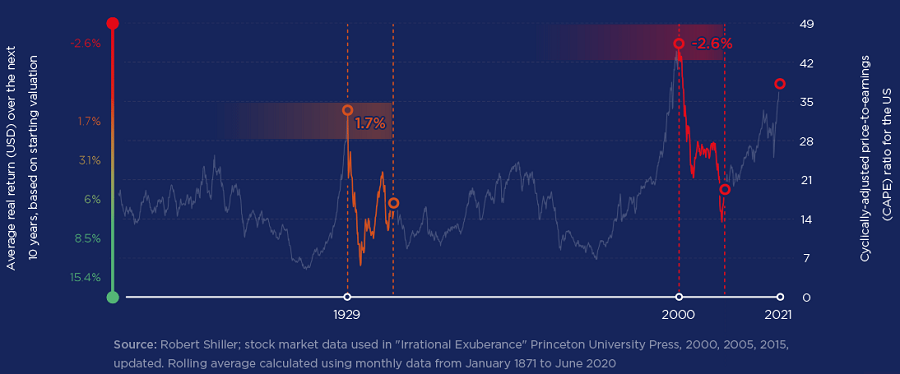
The chart above demonstrates this. It plots the average cyclically adjusted price-to-earnings (CAPE) ratio for the US market over the past 140 years. The CAPE ratio is calculated in a similar way to the standard price-to-earnings (P/E) ratio, but instead of dividing a company’s stock price by one year’s worth of earnings, it uses the average earnings figure for the past 10 years (adjusted for inflation) to smooth out the impact of economic cycles.

Investors tend to use the CAPE ratio as a barometer for how expensive or cheap a market is. A high CAPE ratio tends to indicate that the market is expensive, with the long-term average for the US market somewhere around 17 times.

As you can see, US stockmarkets in aggregate have seldom traded above 30 times. In other words, there have been few times in the past 140 years when investors were willing to pay for more than 30 years’ worth of average earnings upfront and, when they have, the average real return over the following 10 years has been underwhelming, to say the least.

Markets looking expensive in aggregate is not just a US phenomenon. A similar case can be made for the broader FTSE World Index, albeit over a shorter time frame. Over the past 30 years, when the median stock in the FTSE World Index has traded at a starting P/E ratio above 30 times, investors have never made a positive real return over the following four years. At the end of October 2021, the median stock in the FTSE World Index traded close to 30 times.

What does that mean for investors today?

Judging from the chart above, the prospect of stellar returns at an aggregate level over the next few years looks modest at best. If one looks below the headline level, at the individual stocks that make up the market, however, much of the increase in recent years has been driven by a handful of expensive stocks that have become extremely expensive, rather than a groundswell of growth that has pushed up the whole market.

Among those companies that have been left behind, there is a great deal of opportunity to be found, even in a market that is as expensive as the US.

One such example is AES, an independent power producer listed in the US, and a stock held by the Orbis Global Equity Fund. A popular theme for many investors at the moment is the energy transition space, and companies positioned to benefit have been rapidly and, in some cases, extremely bid up. As such, it’s been hard for many investors to find good value in this area. In our view, AES is a rare exception, given it currently trades at around 15 times forward earnings, significantly lower than its peers such as NextEra Energy, which, despite similar levels of earnings growth, trades at more than 30 times forward earnings.

Part of the reason this discount exists is AES’s history and, in particular, its rapid, early expansion. Founded in 1981 as an energy consulting firm, it soon moved into energy generation. By 1988 it had become the largest independent power producer in the US and by 2002 was operating in 29 countries. But, while its share price rose dramatically during these years, it also took on considerable foreign exchange risk, overpaid for assets and consistently missed estimates.

Since 2012, however, the firm has been under new management and overseen a fairly dramatic transformation. While, at a headline level, the firm still does most of the same things, where and how they do them has been significantly improved. Not only has its foreign exchange exposure been dramatically reduced by both its shrunken global footprint and the fact that now around 85% of revenues are denominated in US dollars, but more importantly it has become a leader in green power.

At first glance, AES might not appear very ‘green’ given currently around 25% of the company’s total electricity production is from coal. But, the remainder is derived from renewables and natural gas, and AES is aggressively moving away from coal. Indeed, AES expects coal to account for less than 10% of its total electricity generation in 2025. In addition to its core unit, AES also owns an energy storage joint venture with Siemens called Fluence, currently the second largest energy storage provider globally – second only to Tesla. Management expects Fluence revenue to grow from $100m in 2019 to around $3bn by 2025, with the potential of real blue-sky upside. More recently, Fluence was listed separately, making it one of the largest pure-play energy storage companies in the world. On top of that, late last year, AES announced a 10-year strategic partnership with Google, which we believe, should help to expand its renewable energy project pipeline.

There are, of course, risks to the thesis. AES does have a history of overpromising and underdelivering, albeit under previous management. Then there is the fact that increased competition within the renewables space would put downward pressure on the economics of selling power. And, there does remain some forex risk, especially as not all of its assets are in politically stable jurisdictions. However, we believe these risks have been priced in.

The market overlooks some sectors

And, AES is not alone. There are many other examples, all over the globe from technology to healthcare, from banks to logistics, of companies that are being overlooked by a market focused on a small subset of existing winners.

As bottom-up stock pickers, we are able to search underneath the uncomfortable heights of the headline indices to find exciting opportunities at compelling valuations. By focusing on the starting point and the price we pay, we think this increases the likelihood that we will be successful over the long-term.


Shane Woldendorp, Investment Specialist, Orbis Investments, a sponsor of Firstlinks. This report contains general information only and not personal financial or investment advice. It does not take into account the specific investment objectives, financial situation or individual needs of any particular person.

For more articles and papers from Orbis, please click here.


6 Comments
C ( the other one)
November 20, 2021

Natural gas is not considered very, ‘green’ either.

Alex
November 17, 2021

We have enjoyed a golden era for investing in the last 10 years but hard to see this repeating ... and yet super funds still assume healthy returns in their retirement planning calculators.

Warren Bird
November 17, 2021

Alex, every super fund has adjusted the plan returns down over the past several years. They're not as stupid as your throwaway remark implies. Every super fund board is continually assessing whether to keep plan returns but take more risk to achieve them or adjust the expected returns. Some sort of health check process is built into fund governance processes.

David M
November 20, 2021

Gee Warren, Alex makes a fair point. Tough morning? Stated objective returns and tools for members like planning calculators are what guide & inform Mum & Dad. Too many super funds provide poor information around objective returns - I can think of very large Australian funds which CPI plus 2% as their objective for the last 10 years - and then boast making 10+% returns - all with no regard to the stated objective.

Jack
November 20, 2021

Warren, that's just not correct. Take the biggest super fund in the country. Its super projection retirement calculator has not changed for years https://www.australiansuper.com/tools-and-advice/calculators/super-projection-calculator and still has, for example, for a moderate portfolio return of 6.5%. So where is that coming from with 0% from defensive? ... 13% from growth? That's moderate, nothing in there about taking more risk to achieve returns.

Warren Bird
November 21, 2021

David M and Jack, I beg to differ. Data that Morningstar and other professional research groups have prepared show that all super funds review their objectives regularly, and that at least since 2016 the majority have reduced their plan target returns.
The large super fund on whose investment committee I've served for 8 years has done so.
Upon what facts are your views based? How many super fund Board or Investment Committee meetings have you participated in to have formed a contrary view? Picking one fund that hasn't changed their return (so you say) is not enough to justify you insulting a whole industry of professionals and governance bodies!


Leave a Comment:

RELATED ARTICLES

Key themes from reporting season, and what's next

4 ASX small caps poised for a big year

The accounting tricks that ASX companies play

banner

Most viewed in recent weeks

Raising the GST to 15%

Treasurer Jim Chalmers aims to tackle tax reform but faces challenges. Previous reviews struggled due to political sensitivities, highlighting the need for comprehensive and politically feasible change.

7 examples of how the new super tax will be calculated

You've no doubt heard about Division 296. These case studies show what people at various levels above the $3 million threshold might need to pay the ATO, with examples ranging from under $500 to more than $35,000.

The revolt against Baby Boomer wealth

The $3m super tax could be put down to the Government needing money and the wealthy being easy targets. It’s deeper than that though and this looks at the factors behind the policy and why more taxes on the wealthy are coming.

Meg on SMSFs: Withdrawing assets ahead of the $3m super tax

The super tax has caused an almighty scuffle, but for SMSFs impacted by the proposed tax, a big question remains: what should they do now? Here are ideas for those wanting to withdraw money from their SMSF.

Are franking credits hurting Australia’s economy?

Business investment and per capita GDP have languished over the past decade and the Labor Government is conducting inquiries to find out why. Franking credits should be part of the debate about our stalling economy.

Here's what should replace the $3 million super tax

With Div. 296 looming, is there a smarter way to tax superannuation? This proposes a fairer, income-linked alternative that respects compounding, ensures predictability, and avoids taxing unrealised capital gains. 

Latest Updates

Investment strategies

9 winning investment strategies

There are many ways to invest in stocks, but some strategies are more effective than others. Here are nine tried and tested investment approaches - choosing one of these can improve your chances of reaching your financial goals.

Planning

Super, death and taxes – time to rethink your estate plans?

The $3 million super tax has many rethinking their super strategies, especially issues of wealth transfer on death. This reviews the taxes on super benefits and offers investment alternatives.

Taxation

Raising the GST to 15%

Treasurer Jim Chalmers aims to tackle tax reform but faces challenges. Previous reviews struggled due to political sensitivities, highlighting the need for comprehensive and politically feasible change.

Shares

The megatrend you simply cannot ignore

Markets are reassessing the impact of AI, with initial euphoria giving way to growing scepticism. This shift is evident in the performance of ASX-listed AI beneficiaries, creating potential opportunities.

Gold

Is this the real reason for gold's surge past $3,000?

Concerns over the US fiscal position seem to have overtaken geopolitics and interest rates as the biggest tailwind for gold prices. Even if a debt crisis doesn't seem likely, there could be more support on the way.

Exchange traded products

Is now the time to invest in small caps?

With further RBA rate cuts forecast this year, small caps may be key beneficiaries. There are quality small cap LICs and LITs trading at discounts to net assets, offering opportunities for astute investors.

Strategy

Welcome to the grey war

Forget speculation about a future US-China conflict - it's already happening. Through cyberwarfare and propaganda, China is waging a grey war designed to weaken democracies without firing a single shot.

Sponsors

Alliances

© 2025 Morningstar, Inc. All rights reserved.

Disclaimer
The data, research and opinions provided here are for information purposes; are not an offer to buy or sell a security; and are not warranted to be correct, complete or accurate. Morningstar, its affiliates, and third-party content providers are not responsible for any investment decisions, damages or losses resulting from, or related to, the data and analyses or their use. To the extent any content is general advice, it has been prepared for clients of Morningstar Australasia Pty Ltd (ABN: 95 090 665 544, AFSL: 240892), without reference to your financial objectives, situation or needs. For more information refer to our Financial Services Guide. You should consider the advice in light of these matters and if applicable, the relevant Product Disclosure Statement before making any decision to invest. Past performance does not necessarily indicate a financial product’s future performance. To obtain advice tailored to your situation, contact a professional financial adviser. Articles are current as at date of publication.
This website contains information and opinions provided by third parties. Inclusion of this information does not necessarily represent Morningstar’s positions, strategies or opinions and should not be considered an endorsement by Morningstar.