Over the last month, Westpac, NAB and ANZ collectively reported profits of $20.8 billion. This resulted in commentary in the media about banks being too profitable, especially in light of recent moves to reprice loan rates upwards for both investors and owner occupiers. Whilst large corporations generate big profits in dollar terms, debate often ignores the extent to which these profits have to be shared amongst millions of individual shareholders. For example, Commonwealth Bank has 790,000 shareholders with 1.7 billion shares outstanding, all of which have a claim over the $9.1 billion in cash profit that the bank reported in August. This article looks at different measures of corporate profitability for large Australian listed companies, beyond the billion dollar headlines.
Different measures of profitability
As a fund manager, the $7.8 billion of raw profit generated by Westpac does not mean much. I look at the underlying earnings per share (EPS) which is what the owner of a single share of the company receives from the profit generated in a particular year. We also look at growth in EPS, as often a company’s profits can grow substantially when they make an acquisition, but if that acquisition is funded by issuing a large number of additional shares, profit per share might not actually grow. For example, in 2015, toll road operator Transurban reported revenue growth of 39.6% post the acquisition of Queensland Motorways, sensational growth for a steady business. However, distribution per share grew at a still respectable 14% after issuing additional shares to fund the purchase of the new asset. Additionally, at a company level we also look at measures such as returns and profit margins, which can be better measures of how efficient a company’s management team is in generating the annual profits. Furthermore, these measures allow the investor to compare different companies in similar industries.
Return on Equity
Return on Equity (ROE) looks at the profit being generated by the equity that the owners have contributed to establish the business. ROE is calculated by dividing a company’s profit by the money which shareholders have invested in it. This investment by shareholders includes both original share capital from the IPO plus retained earnings. Retained earnings are the profits kept by the company in excess of dividends and are used to fund capital expenditure to either maintain or grow the company. Companies with high ROE typically require little in the way of dilutive equity raisings from shareholders to run their business, or may be highly geared.
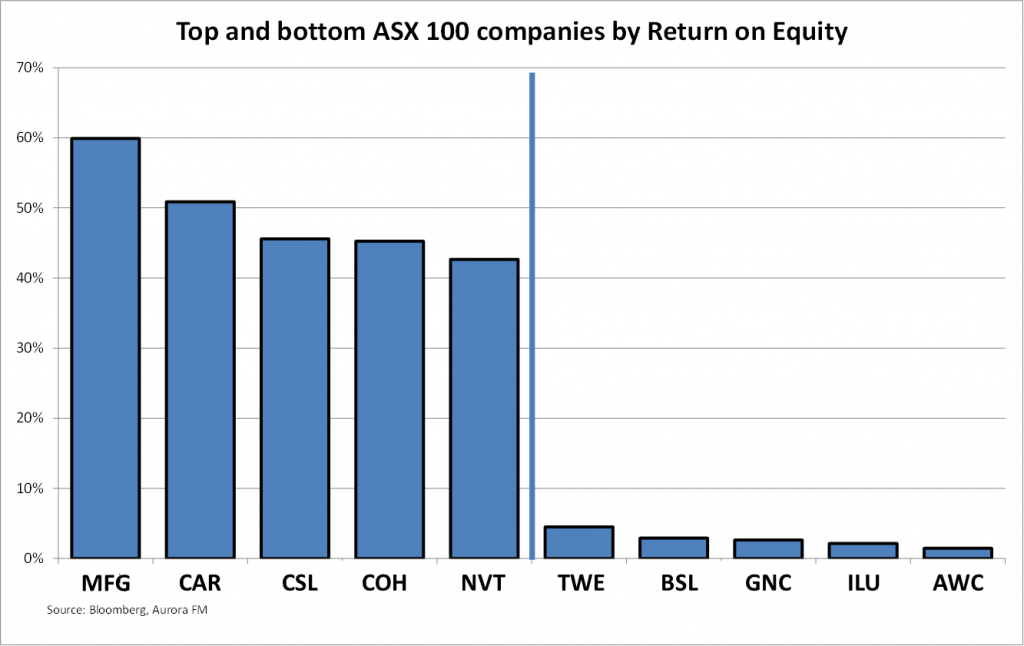
The chart above shows the top and bottom five companies in the ASX as ranked by ROE. The top ROE earners contain a fund manager (Magellan), an internet company (Carsales.com), two healthcare companies (CSL and Cochlear) and an education services provider (Navitas).
The common factor in these businesses is minimal ongoing capital expenditure to run the company. Bringing up the rear are a range of capital heavy businesses that require both large amounts of initial capital to start the business and regular capital expenditure to maintain the quality of their assets and finance their ongoing activities. This sub-set includes a winemaker (Treasury), miners (Iluka and Alumina), a steelmaker (BlueScope) and a gain handler (Graincorp).
Return on Assets
Return on Assets (ROA) differs from ROE, as it measures the return a company makes on its total assets. This measure accounts for both the equity and the debt used to purchase the assets that generate a company’s profits.
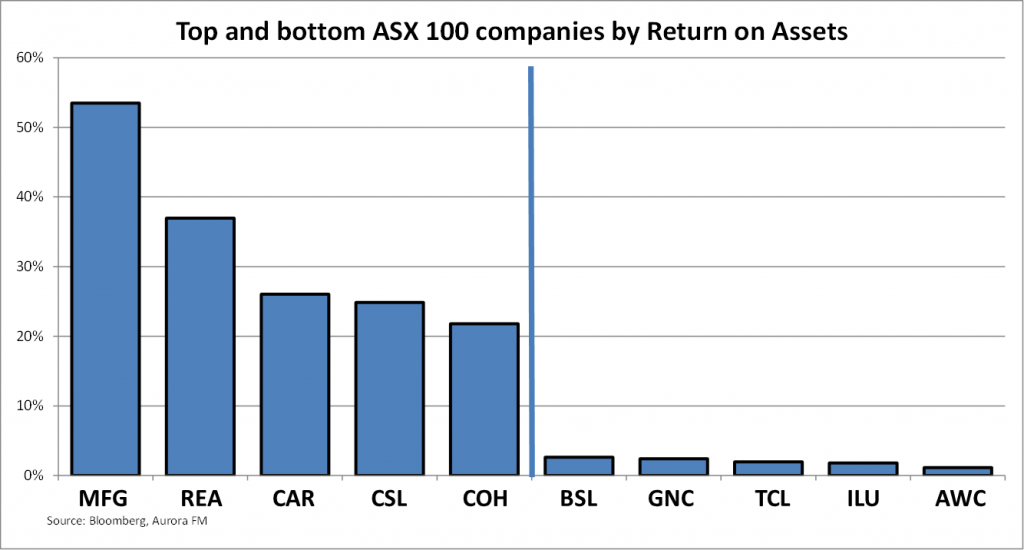
This chart shows the top and bottom companies in the ASX ranked by ROA. Companies generating a high ROA are generally companies with no debt such as Magellan and Realestate.com or very low debt such as CSL and Carsales. Here the factor driving profits in internet and healthcare companies is generally a smart idea (online real estate listing replacing paper) or a piece of medical research, rather than tangible assets such as steel mills or airplanes bought with capital raised from both shareholders and lenders.
Similarly, fund managers (Magellan) enjoy significant operating leverage, as once the fixed cost of fund distribution, office rent and fund manager salaries are covered by a level of funds under management, each additional dollar of revenue is almost pure profit that requires minimal capital.
Alternatively, companies that have a low return on assets typically require expensive hard assets to generate profit and operate in industries where they are price takers. These assets range from mines (Iluka and Alumina), steel mills (BlueScope) and toll roads (Transurban).
Profit margin
Profit margin is calculated by dividing operating profits by revenues and measures the percentage of each dollar received by a company that results in profit to shareholders. Typically, low margin businesses operate in highly competitive mature industries. The absolute profit margin is not what analysts will look at, but rather the change from year to year, as a declining profit margin may indicate stress and could point to large future declines in profits.
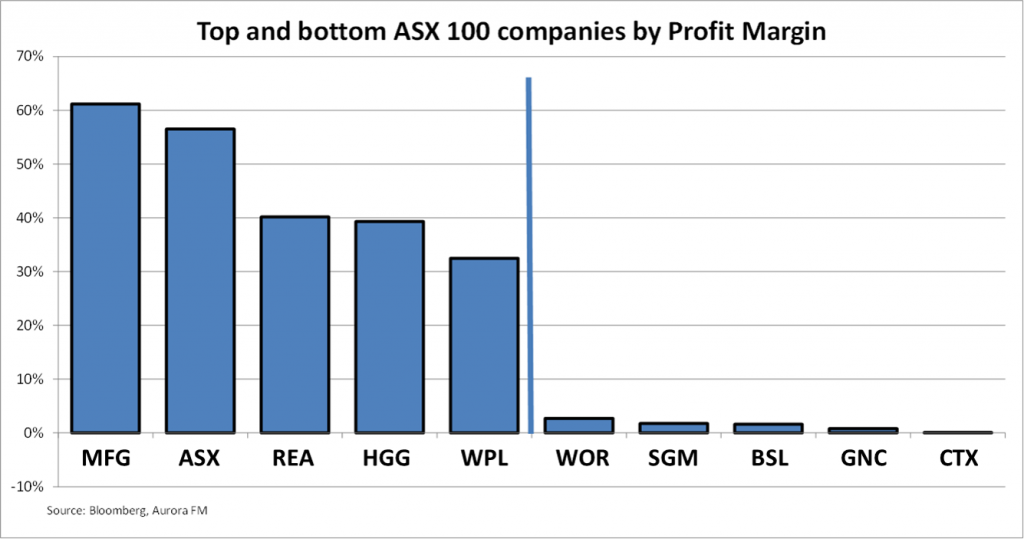
The chart shows the highest profit margins are generated by companies that are monopolies (ASX), fund managers enjoying operating leverage (Magellan and Henderson) or infrastructure owners (Spark, Duet and SP Ausnet). Woodside enjoys a high profit margin, as once large offshore LNG trains are built, these assets have a low marginal cost of production per barrel of oil.
Low profit margin companies characteristically receive large revenues, but operate in intensely competitive industries such as petrol retailing (Caltex), engineering (Worley Parsons) and steel (Sims and BlueScope). Graincorp makes this list due to lower grain exports due to a relatively poor East Coast wheat harvest. Companies with low profit margins are obviously forced to concentrate closely on preventing their profit margins from slipping, as a small change in their margins is likely to have a significant impact on the profit available to be distributed to shareholders.
Whist the banks and the diversified miners generate large absolute profits and generate headlines often gasping at the amount, they are not actually amongst the most profitable large listed Australian companies in terms of profit margins and returns on assets. Westpac’s 35,241 employees produced a $7.8 billion profit in 2015, but this represented a ROE of 15.8% and a profit or net interest margin of only 2.11% on a loan book of $623 billion!
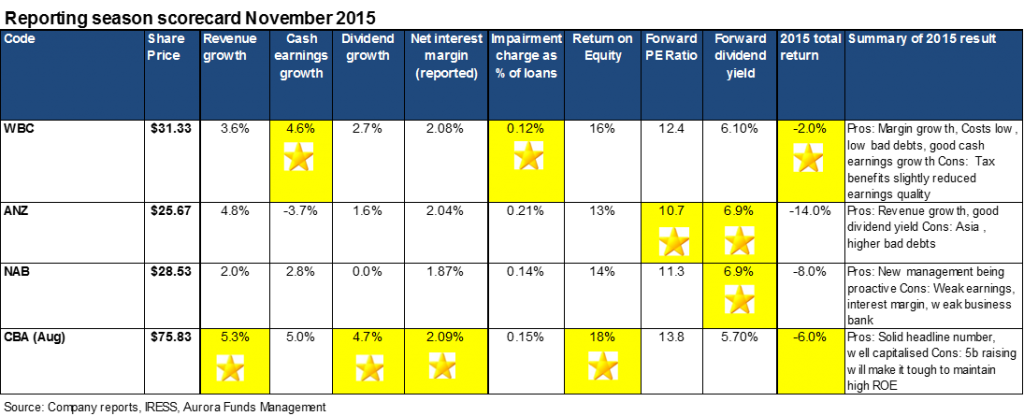
We approach the end of 2015 with our reporting season scorecard for the major banks as follows, with a Gold Star awarded for the best in each category.
Hugh Dive is Senior Portfolio Manager at Aurora Funds Management. This article is general information and does not address the personal circumstances of any individual.